Scotch-Irish vs Immigrants from Somalia College, Under 1 year
COMPARE
Scotch-Irish
Immigrants from Somalia
College, Under 1 year
College, Under 1 year Comparison
Scotch-Irish
Immigrants from Somalia
65.4%
COLLEGE, UNDER 1 YEAR
49.5/ 100
METRIC RATING
175th/ 347
METRIC RANK
65.6%
COLLEGE, UNDER 1 YEAR
56.4/ 100
METRIC RATING
167th/ 347
METRIC RANK
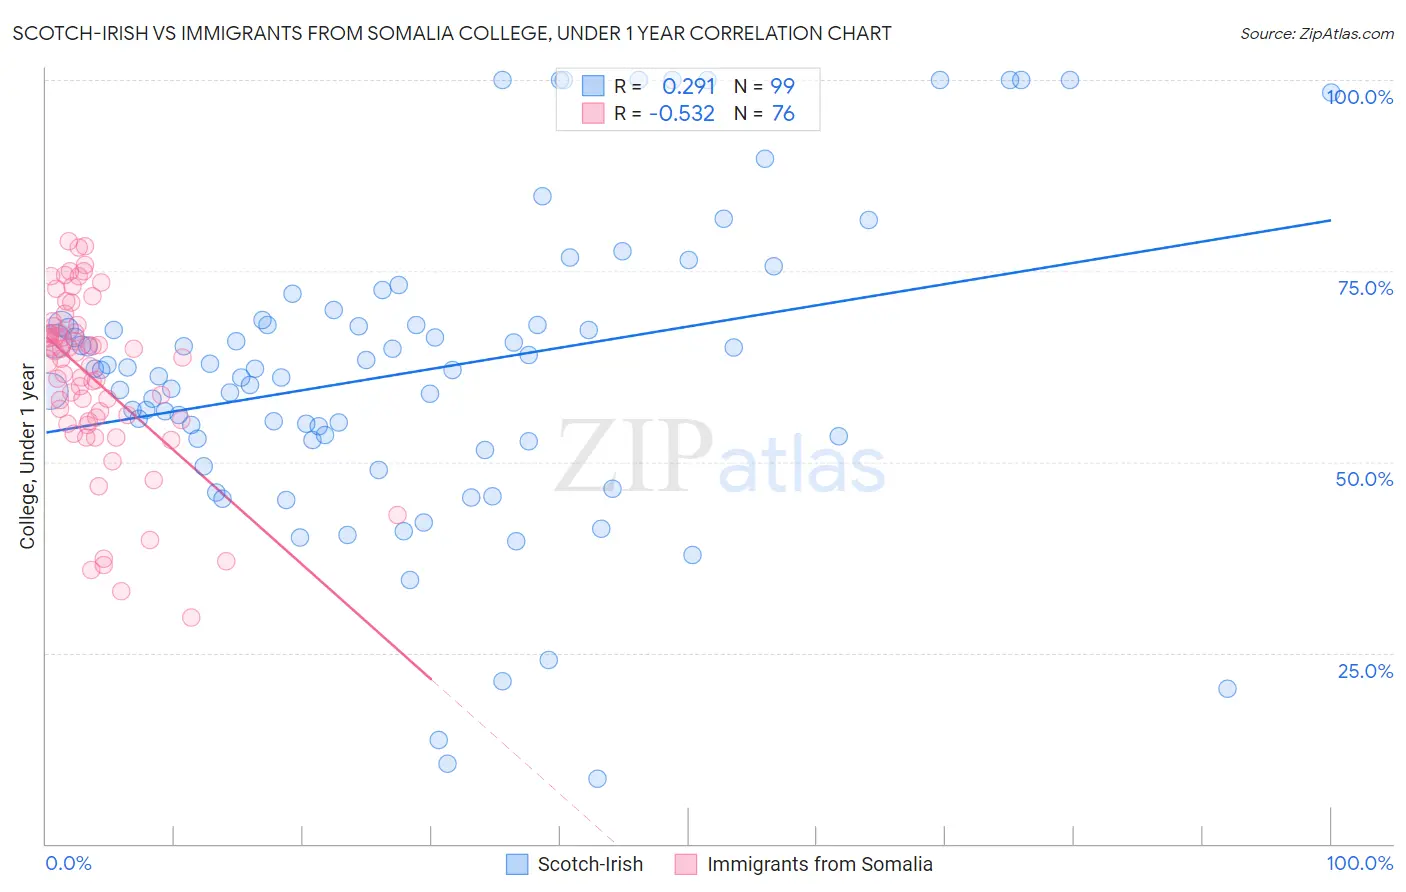
Scotch-Irish vs Immigrants from Somalia College, Under 1 year Correlation Chart
The statistical analysis conducted on geographies consisting of 548,775,844 people shows a weak positive correlation between the proportion of Scotch-Irish and percentage of population with at least college, under 1 year education in the United States with a correlation coefficient (R) of 0.291 and weighted average of 65.4%. Similarly, the statistical analysis conducted on geographies consisting of 92,111,755 people shows a substantial negative correlation between the proportion of Immigrants from Somalia and percentage of population with at least college, under 1 year education in the United States with a correlation coefficient (R) of -0.532 and weighted average of 65.6%, a difference of 0.30%.
College, Under 1 year Correlation Summary
| Measurement | Scotch-Irish | Immigrants from Somalia |
| Minimum | 8.6% | 29.5% |
| Maximum | 100.0% | 78.8% |
| Range | 91.4% | 49.3% |
| Mean | 61.8% | 60.9% |
| Median | 62.1% | 63.6% |
| Interquartile 25% (IQ1) | 52.8% | 55.4% |
| Interquartile 75% (IQ3) | 68.1% | 67.4% |
| Interquartile Range (IQR) | 15.3% | 12.0% |
| Standard Deviation (Sample) | 20.0% | 11.2% |
| Standard Deviation (Population) | 19.9% | 11.1% |
Demographics Similar to Scotch-Irish and Immigrants from Somalia by College, Under 1 year
In terms of college, under 1 year, the demographic groups most similar to Scotch-Irish are Immigrants from Bosnia and Herzegovina (65.4%, a difference of 0.020%), French (65.4%, a difference of 0.030%), Immigrants from North Macedonia (65.4%, a difference of 0.040%), German Russian (65.4%, a difference of 0.050%), and Guamanian/Chamorro (65.4%, a difference of 0.060%). Similarly, the demographic groups most similar to Immigrants from Somalia are Moroccan (65.6%, a difference of 0.010%), Hungarian (65.6%, a difference of 0.020%), Yugoslavian (65.6%, a difference of 0.030%), German (65.6%, a difference of 0.030%), and Immigrants from Oceania (65.6%, a difference of 0.060%).
| Demographics | Rating | Rank | College, Under 1 year |
| Brazilians | 66.0 /100 | #161 | Good 65.9% |
| Koreans | 65.3 /100 | #162 | Good 65.9% |
| Somalis | 62.7 /100 | #163 | Good 65.8% |
| Czechoslovakians | 62.6 /100 | #164 | Good 65.8% |
| Immigrants | Uzbekistan | 61.6 /100 | #165 | Good 65.8% |
| Moroccans | 56.7 /100 | #166 | Average 65.6% |
| Immigrants | Somalia | 56.4 /100 | #167 | Average 65.6% |
| Hungarians | 55.9 /100 | #168 | Average 65.6% |
| Yugoslavians | 55.7 /100 | #169 | Average 65.6% |
| Germans | 55.7 /100 | #170 | Average 65.6% |
| Immigrants | Oceania | 55.0 /100 | #171 | Average 65.6% |
| South American Indians | 54.4 /100 | #172 | Average 65.5% |
| Swiss | 53.9 /100 | #173 | Average 65.5% |
| Immigrants | Bosnia and Herzegovina | 50.0 /100 | #174 | Average 65.4% |
| Scotch-Irish | 49.5 /100 | #175 | Average 65.4% |
| French | 48.9 /100 | #176 | Average 65.4% |
| Immigrants | North Macedonia | 48.6 /100 | #177 | Average 65.4% |
| German Russians | 48.3 /100 | #178 | Average 65.4% |
| Guamanians/Chamorros | 48.2 /100 | #179 | Average 65.4% |
| Dutch | 46.1 /100 | #180 | Average 65.3% |
| Spaniards | 45.5 /100 | #181 | Average 65.3% |