Scotch-Irish vs Dominican Doctorate Degree
COMPARE
Scotch-Irish
Dominican
Doctorate Degree
Doctorate Degree Comparison
Scotch-Irish
Dominicans
1.9%
DOCTORATE DEGREE
63.6/ 100
METRIC RATING
165th/ 347
METRIC RANK
1.4%
DOCTORATE DEGREE
0.1/ 100
METRIC RATING
314th/ 347
METRIC RANK
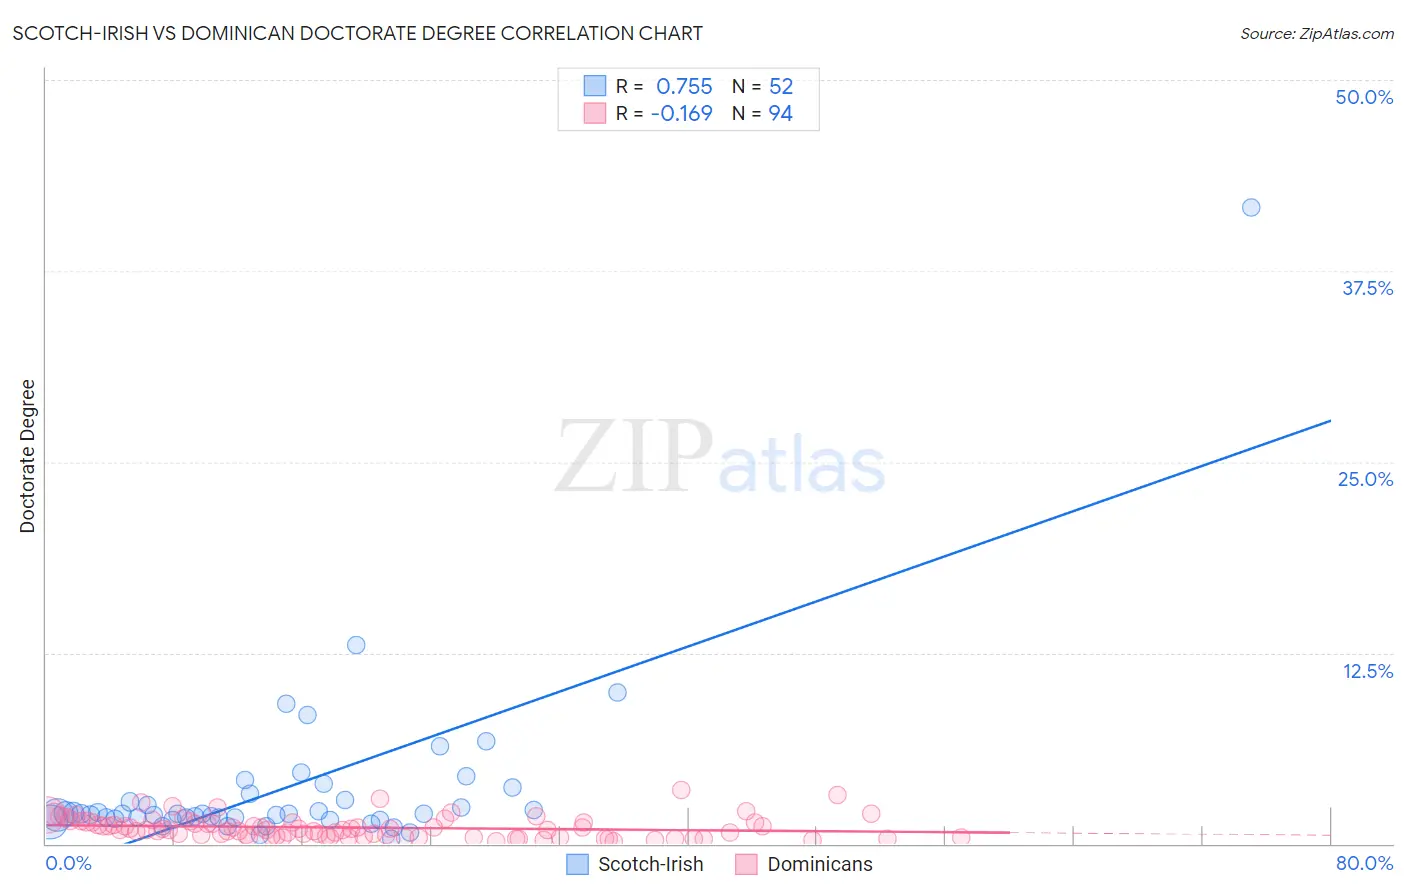
Scotch-Irish vs Dominican Doctorate Degree Correlation Chart
The statistical analysis conducted on geographies consisting of 527,994,945 people shows a strong positive correlation between the proportion of Scotch-Irish and percentage of population with at least doctorate degree education in the United States with a correlation coefficient (R) of 0.755 and weighted average of 1.9%. Similarly, the statistical analysis conducted on geographies consisting of 351,566,637 people shows a poor negative correlation between the proportion of Dominicans and percentage of population with at least doctorate degree education in the United States with a correlation coefficient (R) of -0.169 and weighted average of 1.4%, a difference of 38.6%.
Doctorate Degree Correlation Summary
| Measurement | Scotch-Irish | Dominican |
| Minimum | 0.30% | 0.14% |
| Maximum | 41.7% | 3.5% |
| Range | 41.4% | 3.4% |
| Mean | 3.6% | 1.1% |
| Median | 1.9% | 0.94% |
| Interquartile 25% (IQ1) | 1.7% | 0.51% |
| Interquartile 75% (IQ3) | 3.1% | 1.4% |
| Interquartile Range (IQR) | 1.4% | 0.88% |
| Standard Deviation (Sample) | 5.9% | 0.69% |
| Standard Deviation (Population) | 5.9% | 0.69% |
Similar Demographics by Doctorate Degree
Demographics Similar to Scotch-Irish by Doctorate Degree
In terms of doctorate degree, the demographic groups most similar to Scotch-Irish are Spaniard (1.9%, a difference of 0.020%), Macedonian (1.9%, a difference of 0.41%), Celtic (1.9%, a difference of 0.49%), Sri Lankan (1.9%, a difference of 0.51%), and Czech (1.9%, a difference of 0.58%).
| Demographics | Rating | Rank | Doctorate Degree |
| Hungarians | 71.7 /100 | #158 | Good 1.9% |
| Slovenes | 70.2 /100 | #159 | Good 1.9% |
| Welsh | 69.7 /100 | #160 | Good 1.9% |
| Immigrants | Middle Africa | 68.8 /100 | #161 | Good 1.9% |
| Irish | 67.5 /100 | #162 | Good 1.9% |
| Czechs | 67.3 /100 | #163 | Good 1.9% |
| Celtics | 66.7 /100 | #164 | Good 1.9% |
| Scotch-Irish | 63.6 /100 | #165 | Good 1.9% |
| Spaniards | 63.5 /100 | #166 | Good 1.9% |
| Macedonians | 60.9 /100 | #167 | Good 1.9% |
| Sri Lankans | 60.3 /100 | #168 | Good 1.9% |
| Vietnamese | 54.8 /100 | #169 | Average 1.9% |
| Costa Ricans | 53.3 /100 | #170 | Average 1.8% |
| Bermudans | 52.1 /100 | #171 | Average 1.8% |
| Belgians | 50.3 /100 | #172 | Average 1.8% |
Demographics Similar to Dominicans by Doctorate Degree
In terms of doctorate degree, the demographic groups most similar to Dominicans are Immigrants from the Azores (1.4%, a difference of 0.020%), Menominee (1.4%, a difference of 0.080%), Navajo (1.4%, a difference of 0.23%), Immigrants from Nicaragua (1.4%, a difference of 0.39%), and Immigrants from Micronesia (1.3%, a difference of 0.48%).
| Demographics | Rating | Rank | Doctorate Degree |
| Cubans | 0.1 /100 | #307 | Tragic 1.4% |
| Immigrants | Laos | 0.1 /100 | #308 | Tragic 1.4% |
| Immigrants | Grenada | 0.1 /100 | #309 | Tragic 1.4% |
| Immigrants | Jamaica | 0.1 /100 | #310 | Tragic 1.4% |
| Immigrants | Honduras | 0.1 /100 | #311 | Tragic 1.4% |
| Immigrants | Nicaragua | 0.1 /100 | #312 | Tragic 1.4% |
| Menominee | 0.1 /100 | #313 | Tragic 1.4% |
| Dominicans | 0.1 /100 | #314 | Tragic 1.4% |
| Immigrants | Azores | 0.1 /100 | #315 | Tragic 1.4% |
| Navajo | 0.1 /100 | #316 | Tragic 1.4% |
| Immigrants | Micronesia | 0.1 /100 | #317 | Tragic 1.3% |
| Creek | 0.1 /100 | #318 | Tragic 1.3% |
| Immigrants | Guyana | 0.1 /100 | #319 | Tragic 1.3% |
| Immigrants | St. Vincent and the Grenadines | 0.1 /100 | #320 | Tragic 1.3% |
| Dutch West Indians | 0.1 /100 | #321 | Tragic 1.3% |