Zimbabwean vs Dominican 11th Grade
COMPARE
Zimbabwean
Dominican
11th Grade
11th Grade Comparison
Zimbabweans
Dominicans
93.9%
11TH GRADE
99.8/ 100
METRIC RATING
68th/ 347
METRIC RANK
87.7%
11TH GRADE
0.0/ 100
METRIC RATING
326th/ 347
METRIC RANK
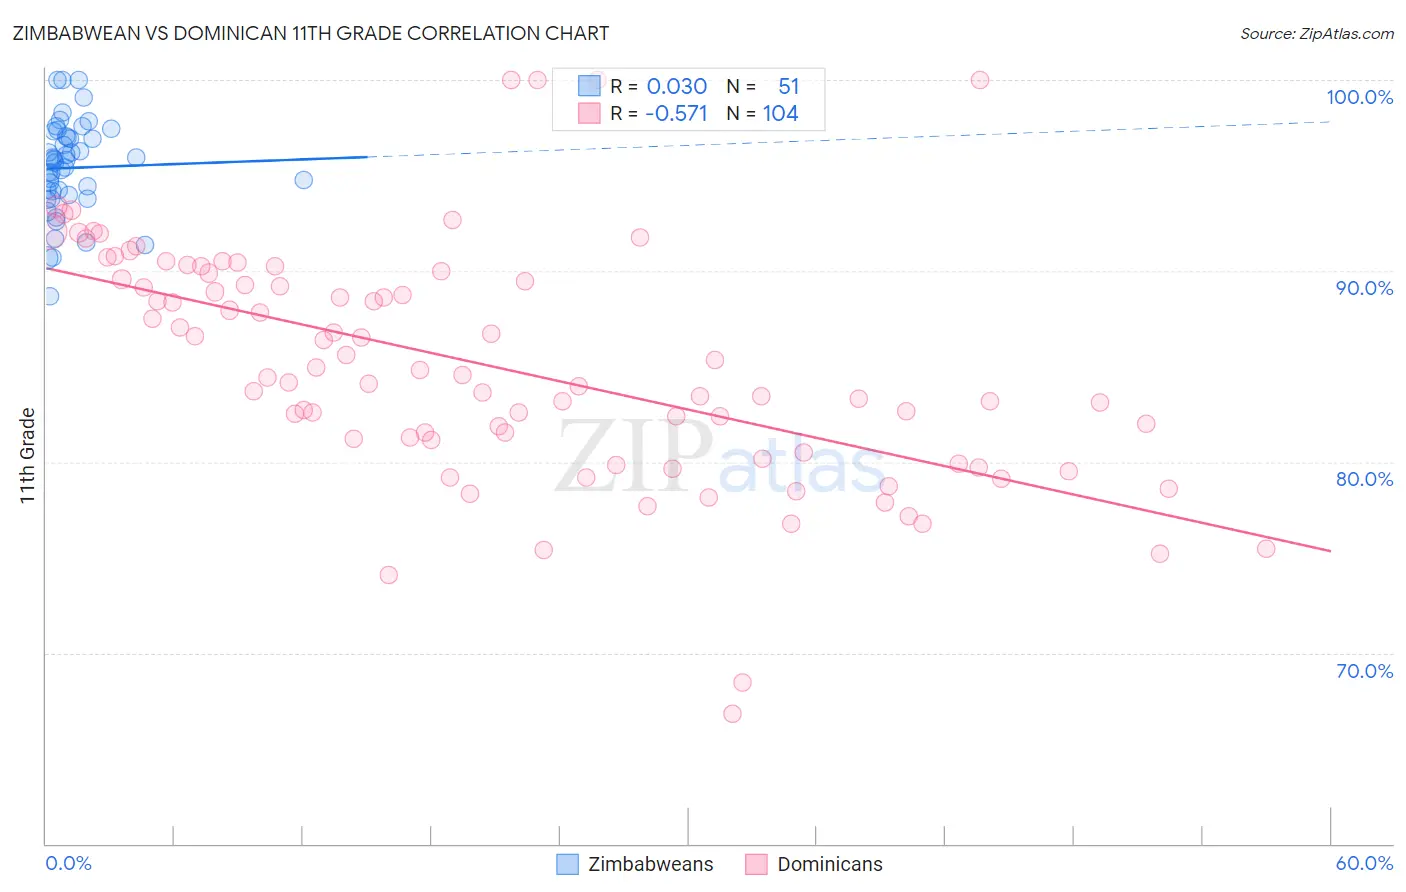
Zimbabwean vs Dominican 11th Grade Correlation Chart
The statistical analysis conducted on geographies consisting of 69,203,423 people shows no correlation between the proportion of Zimbabweans and percentage of population with at least 11th grade education in the United States with a correlation coefficient (R) of 0.030 and weighted average of 93.9%. Similarly, the statistical analysis conducted on geographies consisting of 355,142,452 people shows a substantial negative correlation between the proportion of Dominicans and percentage of population with at least 11th grade education in the United States with a correlation coefficient (R) of -0.571 and weighted average of 87.7%, a difference of 7.1%.
11th Grade Correlation Summary
| Measurement | Zimbabwean | Dominican |
| Minimum | 88.7% | 66.8% |
| Maximum | 100.0% | 100.0% |
| Range | 11.3% | 33.2% |
| Mean | 95.4% | 85.1% |
| Median | 95.8% | 84.5% |
| Interquartile 25% (IQ1) | 94.0% | 80.8% |
| Interquartile 75% (IQ3) | 97.1% | 89.7% |
| Interquartile Range (IQR) | 3.1% | 8.9% |
| Standard Deviation (Sample) | 2.5% | 6.2% |
| Standard Deviation (Population) | 2.4% | 6.2% |
Similar Demographics by 11th Grade
Demographics Similar to Zimbabweans by 11th Grade
In terms of 11th grade, the demographic groups most similar to Zimbabweans are Scotch-Irish (93.9%, a difference of 0.0%), Alaskan Athabascan (93.9%, a difference of 0.020%), Immigrants from Netherlands (93.9%, a difference of 0.020%), Immigrants from Sweden (93.9%, a difference of 0.040%), and Native Hawaiian (93.9%, a difference of 0.040%).
| Demographics | Rating | Rank | 11th Grade |
| Immigrants | Belgium | 99.8 /100 | #61 | Exceptional 94.0% |
| Austrians | 99.8 /100 | #62 | Exceptional 94.0% |
| Ukrainians | 99.8 /100 | #63 | Exceptional 94.0% |
| Immigrants | Sweden | 99.8 /100 | #64 | Exceptional 93.9% |
| Native Hawaiians | 99.8 /100 | #65 | Exceptional 93.9% |
| Alaskan Athabascans | 99.8 /100 | #66 | Exceptional 93.9% |
| Immigrants | Netherlands | 99.8 /100 | #67 | Exceptional 93.9% |
| Zimbabweans | 99.8 /100 | #68 | Exceptional 93.9% |
| Scotch-Irish | 99.8 /100 | #69 | Exceptional 93.9% |
| Immigrants | England | 99.7 /100 | #70 | Exceptional 93.8% |
| Immigrants | South Africa | 99.7 /100 | #71 | Exceptional 93.8% |
| Immigrants | Japan | 99.7 /100 | #72 | Exceptional 93.8% |
| Romanians | 99.6 /100 | #73 | Exceptional 93.8% |
| Immigrants | Czechoslovakia | 99.6 /100 | #74 | Exceptional 93.8% |
| Immigrants | Latvia | 99.6 /100 | #75 | Exceptional 93.8% |
Demographics Similar to Dominicans by 11th Grade
In terms of 11th grade, the demographic groups most similar to Dominicans are Immigrants from Cabo Verde (87.6%, a difference of 0.020%), Tohono O'odham (87.6%, a difference of 0.080%), Mexican American Indian (87.5%, a difference of 0.15%), Honduran (87.4%, a difference of 0.34%), and Hispanic or Latino (87.3%, a difference of 0.40%).
| Demographics | Rating | Rank | 11th Grade |
| Belizeans | 0.0 /100 | #319 | Tragic 88.8% |
| Immigrants | Armenia | 0.0 /100 | #320 | Tragic 88.8% |
| Immigrants | Belize | 0.0 /100 | #321 | Tragic 88.7% |
| Puerto Ricans | 0.0 /100 | #322 | Tragic 88.4% |
| Pima | 0.0 /100 | #323 | Tragic 88.3% |
| Central American Indians | 0.0 /100 | #324 | Tragic 88.2% |
| Immigrants | Nicaragua | 0.0 /100 | #325 | Tragic 88.1% |
| Dominicans | 0.0 /100 | #326 | Tragic 87.7% |
| Immigrants | Cabo Verde | 0.0 /100 | #327 | Tragic 87.6% |
| Tohono O'odham | 0.0 /100 | #328 | Tragic 87.6% |
| Mexican American Indians | 0.0 /100 | #329 | Tragic 87.5% |
| Hondurans | 0.0 /100 | #330 | Tragic 87.4% |
| Hispanics or Latinos | 0.0 /100 | #331 | Tragic 87.3% |
| Immigrants | Azores | 0.0 /100 | #332 | Tragic 87.2% |
| Immigrants | Yemen | 0.0 /100 | #333 | Tragic 87.1% |