Nicaraguan vs Immigrants from Sierra Leone Bachelor's Degree
COMPARE
Nicaraguan
Immigrants from Sierra Leone
Bachelor's Degree
Bachelor's Degree Comparison
Nicaraguans
Immigrants from Sierra Leone
33.1%
BACHELOR'S DEGREE
0.6/ 100
METRIC RATING
256th/ 347
METRIC RANK
39.0%
BACHELOR'S DEGREE
79.0/ 100
METRIC RATING
147th/ 347
METRIC RANK
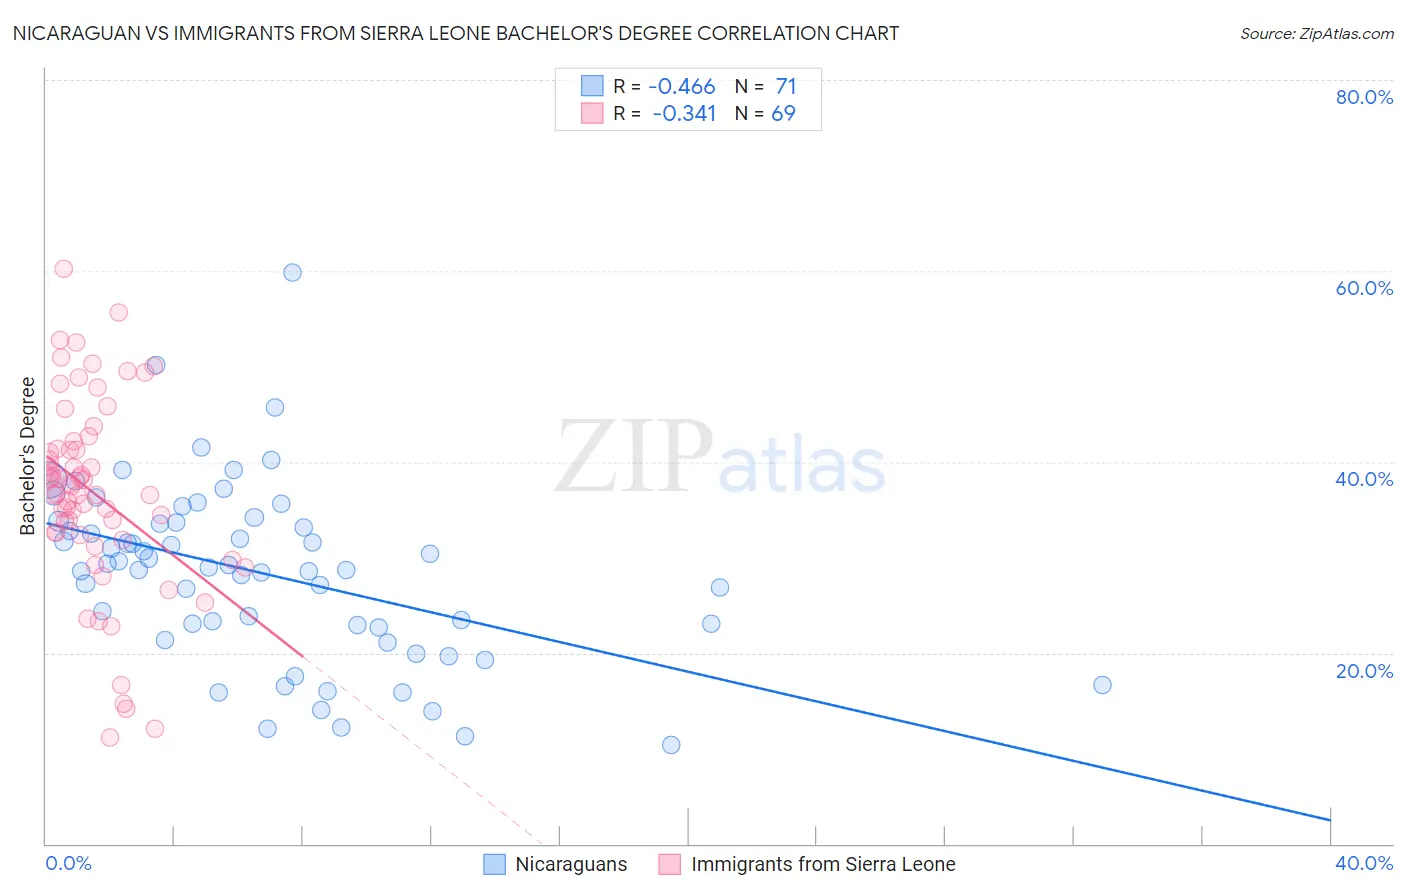
Nicaraguan vs Immigrants from Sierra Leone Bachelor's Degree Correlation Chart
The statistical analysis conducted on geographies consisting of 285,704,287 people shows a moderate negative correlation between the proportion of Nicaraguans and percentage of population with at least bachelor's degree education in the United States with a correlation coefficient (R) of -0.466 and weighted average of 33.1%. Similarly, the statistical analysis conducted on geographies consisting of 101,624,736 people shows a mild negative correlation between the proportion of Immigrants from Sierra Leone and percentage of population with at least bachelor's degree education in the United States with a correlation coefficient (R) of -0.341 and weighted average of 39.0%, a difference of 17.8%.
Bachelor's Degree Correlation Summary
| Measurement | Nicaraguan | Immigrants from Sierra Leone |
| Minimum | 10.4% | 11.2% |
| Maximum | 59.8% | 60.2% |
| Range | 49.4% | 49.0% |
| Mean | 28.3% | 36.8% |
| Median | 29.0% | 37.5% |
| Interquartile 25% (IQ1) | 22.7% | 32.5% |
| Interquartile 75% (IQ3) | 33.7% | 41.7% |
| Interquartile Range (IQR) | 11.0% | 9.2% |
| Standard Deviation (Sample) | 9.3% | 10.1% |
| Standard Deviation (Population) | 9.3% | 10.0% |
Similar Demographics by Bachelor's Degree
Demographics Similar to Nicaraguans by Bachelor's Degree
In terms of bachelor's degree, the demographic groups most similar to Nicaraguans are Iroquois (33.2%, a difference of 0.19%), Native Hawaiian (33.2%, a difference of 0.20%), Spanish American (33.1%, a difference of 0.22%), French American Indian (33.1%, a difference of 0.26%), and U.S. Virgin Islander (33.2%, a difference of 0.27%).
| Demographics | Rating | Rank | Bachelor's Degree |
| Immigrants | Liberia | 0.9 /100 | #249 | Tragic 33.5% |
| Indonesians | 0.9 /100 | #250 | Tragic 33.5% |
| Japanese | 0.7 /100 | #251 | Tragic 33.3% |
| Immigrants | Bahamas | 0.7 /100 | #252 | Tragic 33.3% |
| U.S. Virgin Islanders | 0.7 /100 | #253 | Tragic 33.2% |
| Native Hawaiians | 0.7 /100 | #254 | Tragic 33.2% |
| Iroquois | 0.7 /100 | #255 | Tragic 33.2% |
| Nicaraguans | 0.6 /100 | #256 | Tragic 33.1% |
| Spanish Americans | 0.6 /100 | #257 | Tragic 33.1% |
| French American Indians | 0.6 /100 | #258 | Tragic 33.1% |
| Osage | 0.5 /100 | #259 | Tragic 33.0% |
| Malaysians | 0.5 /100 | #260 | Tragic 32.9% |
| Africans | 0.5 /100 | #261 | Tragic 32.9% |
| Immigrants | Jamaica | 0.5 /100 | #262 | Tragic 32.9% |
| Belizeans | 0.4 /100 | #263 | Tragic 32.8% |
Demographics Similar to Immigrants from Sierra Leone by Bachelor's Degree
In terms of bachelor's degree, the demographic groups most similar to Immigrants from Sierra Leone are Swedish (39.1%, a difference of 0.030%), Slovene (39.1%, a difference of 0.070%), Immigrants from Afghanistan (39.1%, a difference of 0.10%), Polish (39.1%, a difference of 0.12%), and Iraqi (39.0%, a difference of 0.14%).
| Demographics | Rating | Rank | Bachelor's Degree |
| Immigrants | Armenia | 84.1 /100 | #140 | Excellent 39.4% |
| South American Indians | 83.6 /100 | #141 | Excellent 39.3% |
| Immigrants | North Macedonia | 81.6 /100 | #142 | Excellent 39.2% |
| Poles | 79.8 /100 | #143 | Good 39.1% |
| Immigrants | Afghanistan | 79.7 /100 | #144 | Good 39.1% |
| Slovenes | 79.5 /100 | #145 | Good 39.1% |
| Swedes | 79.2 /100 | #146 | Good 39.1% |
| Immigrants | Sierra Leone | 79.0 /100 | #147 | Good 39.0% |
| Iraqis | 78.1 /100 | #148 | Good 39.0% |
| Immigrants | Poland | 77.5 /100 | #149 | Good 39.0% |
| South Americans | 77.3 /100 | #150 | Good 38.9% |
| Immigrants | Africa | 76.5 /100 | #151 | Good 38.9% |
| Sudanese | 76.4 /100 | #152 | Good 38.9% |
| Slavs | 75.9 /100 | #153 | Good 38.9% |
| Canadians | 75.0 /100 | #154 | Good 38.8% |