Puerto Rican vs Immigrants from Sierra Leone Bachelor's Degree
COMPARE
Puerto Rican
Immigrants from Sierra Leone
Bachelor's Degree
Bachelor's Degree Comparison
Puerto Ricans
Immigrants from Sierra Leone
31.0%
BACHELOR'S DEGREE
0.1/ 100
METRIC RATING
289th/ 347
METRIC RANK
39.0%
BACHELOR'S DEGREE
79.0/ 100
METRIC RATING
147th/ 347
METRIC RANK
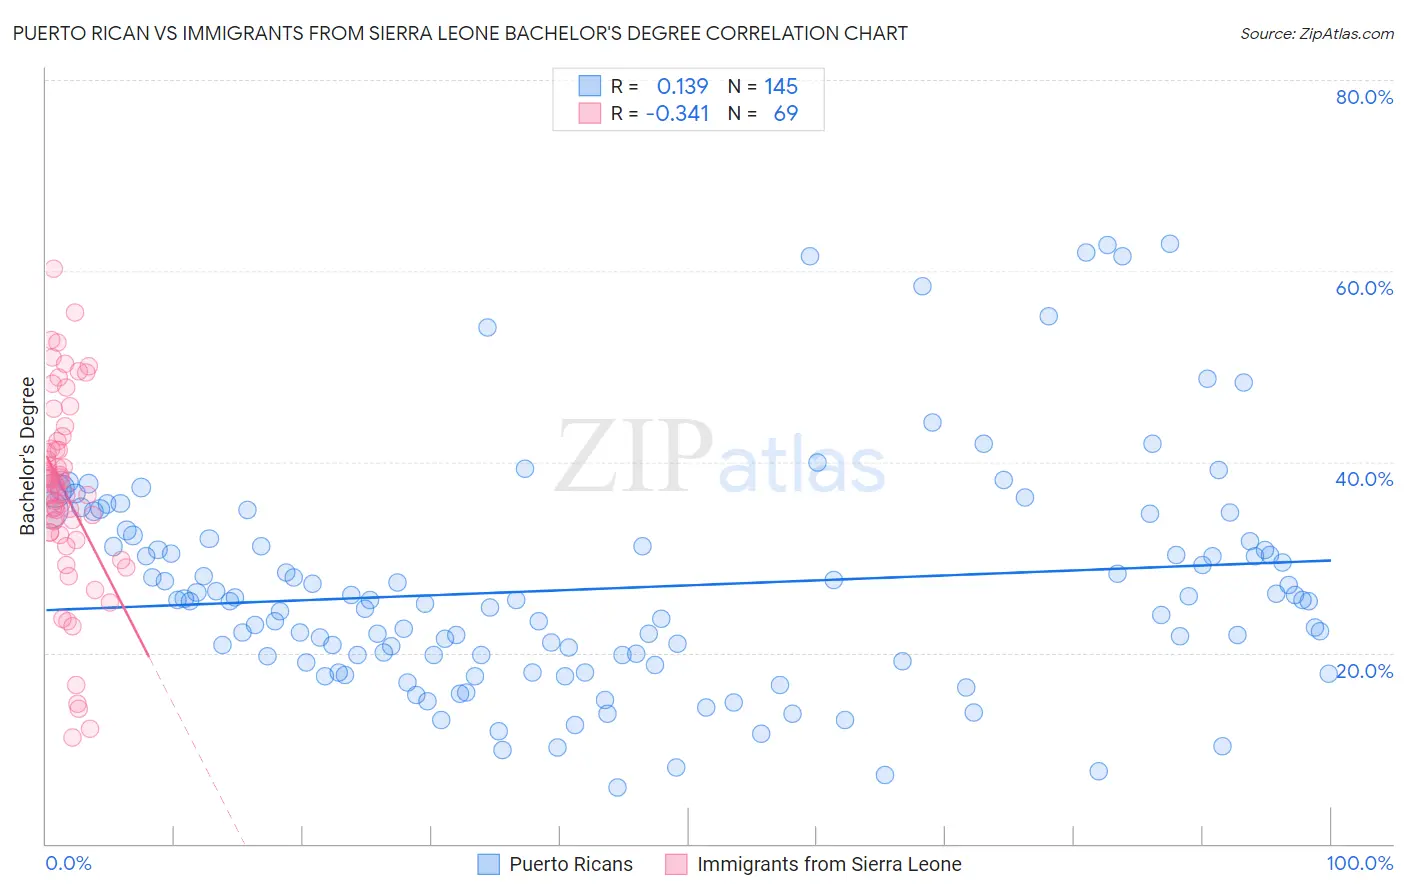
Puerto Rican vs Immigrants from Sierra Leone Bachelor's Degree Correlation Chart
The statistical analysis conducted on geographies consisting of 528,221,445 people shows a poor positive correlation between the proportion of Puerto Ricans and percentage of population with at least bachelor's degree education in the United States with a correlation coefficient (R) of 0.139 and weighted average of 31.0%. Similarly, the statistical analysis conducted on geographies consisting of 101,624,736 people shows a mild negative correlation between the proportion of Immigrants from Sierra Leone and percentage of population with at least bachelor's degree education in the United States with a correlation coefficient (R) of -0.341 and weighted average of 39.0%, a difference of 26.1%.
Bachelor's Degree Correlation Summary
| Measurement | Puerto Rican | Immigrants from Sierra Leone |
| Minimum | 5.9% | 11.2% |
| Maximum | 62.9% | 60.2% |
| Range | 57.0% | 49.0% |
| Mean | 26.8% | 36.8% |
| Median | 25.4% | 37.5% |
| Interquartile 25% (IQ1) | 19.4% | 32.5% |
| Interquartile 75% (IQ3) | 31.8% | 41.7% |
| Interquartile Range (IQR) | 12.4% | 9.2% |
| Standard Deviation (Sample) | 11.7% | 10.1% |
| Standard Deviation (Population) | 11.7% | 10.0% |
Similar Demographics by Bachelor's Degree
Demographics Similar to Puerto Ricans by Bachelor's Degree
In terms of bachelor's degree, the demographic groups most similar to Puerto Ricans are Immigrants from Honduras (30.9%, a difference of 0.040%), Black/African American (30.9%, a difference of 0.080%), Guatemalan (31.0%, a difference of 0.14%), Ute (30.9%, a difference of 0.16%), and Cape Verdean (30.9%, a difference of 0.26%).
| Demographics | Rating | Rank | Bachelor's Degree |
| Immigrants | Caribbean | 0.1 /100 | #282 | Tragic 31.4% |
| Hondurans | 0.1 /100 | #283 | Tragic 31.3% |
| Haitians | 0.1 /100 | #284 | Tragic 31.3% |
| Aleuts | 0.1 /100 | #285 | Tragic 31.3% |
| Immigrants | El Salvador | 0.1 /100 | #286 | Tragic 31.3% |
| Ottawa | 0.1 /100 | #287 | Tragic 31.1% |
| Guatemalans | 0.1 /100 | #288 | Tragic 31.0% |
| Puerto Ricans | 0.1 /100 | #289 | Tragic 31.0% |
| Immigrants | Honduras | 0.1 /100 | #290 | Tragic 30.9% |
| Blacks/African Americans | 0.1 /100 | #291 | Tragic 30.9% |
| Ute | 0.1 /100 | #292 | Tragic 30.9% |
| Cape Verdeans | 0.1 /100 | #293 | Tragic 30.9% |
| Immigrants | Guatemala | 0.0 /100 | #294 | Tragic 30.8% |
| Immigrants | Dominican Republic | 0.0 /100 | #295 | Tragic 30.7% |
| Puget Sound Salish | 0.0 /100 | #296 | Tragic 30.7% |
Demographics Similar to Immigrants from Sierra Leone by Bachelor's Degree
In terms of bachelor's degree, the demographic groups most similar to Immigrants from Sierra Leone are Swedish (39.1%, a difference of 0.030%), Slovene (39.1%, a difference of 0.070%), Immigrants from Afghanistan (39.1%, a difference of 0.10%), Polish (39.1%, a difference of 0.12%), and Iraqi (39.0%, a difference of 0.14%).
| Demographics | Rating | Rank | Bachelor's Degree |
| Immigrants | Armenia | 84.1 /100 | #140 | Excellent 39.4% |
| South American Indians | 83.6 /100 | #141 | Excellent 39.3% |
| Immigrants | North Macedonia | 81.6 /100 | #142 | Excellent 39.2% |
| Poles | 79.8 /100 | #143 | Good 39.1% |
| Immigrants | Afghanistan | 79.7 /100 | #144 | Good 39.1% |
| Slovenes | 79.5 /100 | #145 | Good 39.1% |
| Swedes | 79.2 /100 | #146 | Good 39.1% |
| Immigrants | Sierra Leone | 79.0 /100 | #147 | Good 39.0% |
| Iraqis | 78.1 /100 | #148 | Good 39.0% |
| Immigrants | Poland | 77.5 /100 | #149 | Good 39.0% |
| South Americans | 77.3 /100 | #150 | Good 38.9% |
| Immigrants | Africa | 76.5 /100 | #151 | Good 38.9% |
| Sudanese | 76.4 /100 | #152 | Good 38.9% |
| Slavs | 75.9 /100 | #153 | Good 38.9% |
| Canadians | 75.0 /100 | #154 | Good 38.8% |