Ghanaian vs Immigrants from Austria Bachelor's Degree
COMPARE
Ghanaian
Immigrants from Austria
Bachelor's Degree
Bachelor's Degree Comparison
Ghanaians
Immigrants from Austria
38.0%
BACHELOR'S DEGREE
55.3/ 100
METRIC RATING
169th/ 347
METRIC RANK
44.2%
BACHELOR'S DEGREE
99.9/ 100
METRIC RATING
54th/ 347
METRIC RANK
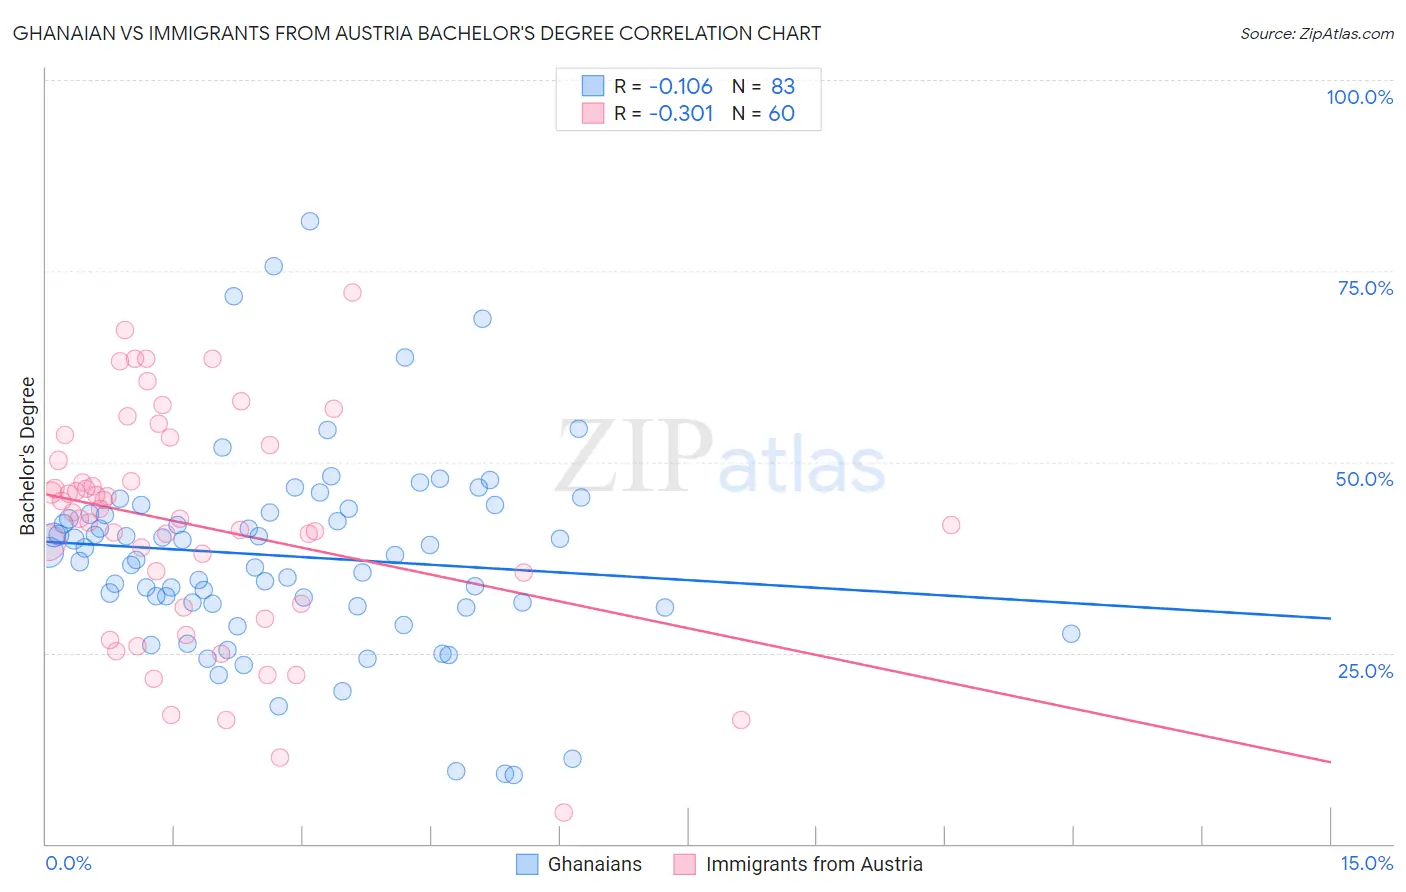
Ghanaian vs Immigrants from Austria Bachelor's Degree Correlation Chart
The statistical analysis conducted on geographies consisting of 190,675,931 people shows a poor negative correlation between the proportion of Ghanaians and percentage of population with at least bachelor's degree education in the United States with a correlation coefficient (R) of -0.106 and weighted average of 38.0%. Similarly, the statistical analysis conducted on geographies consisting of 167,971,732 people shows a mild negative correlation between the proportion of Immigrants from Austria and percentage of population with at least bachelor's degree education in the United States with a correlation coefficient (R) of -0.301 and weighted average of 44.2%, a difference of 16.3%.
Bachelor's Degree Correlation Summary
| Measurement | Ghanaian | Immigrants from Austria |
| Minimum | 9.1% | 4.1% |
| Maximum | 81.5% | 72.2% |
| Range | 72.4% | 68.1% |
| Mean | 37.6% | 41.7% |
| Median | 37.7% | 43.0% |
| Interquartile 25% (IQ1) | 31.1% | 31.2% |
| Interquartile 75% (IQ3) | 43.4% | 51.2% |
| Interquartile Range (IQR) | 12.4% | 20.0% |
| Standard Deviation (Sample) | 13.2% | 14.7% |
| Standard Deviation (Population) | 13.1% | 14.6% |
Similar Demographics by Bachelor's Degree
Demographics Similar to Ghanaians by Bachelor's Degree
In terms of bachelor's degree, the demographic groups most similar to Ghanaians are Danish (38.1%, a difference of 0.090%), Czech (38.0%, a difference of 0.10%), Bermudan (38.0%, a difference of 0.11%), Scottish (38.1%, a difference of 0.12%), and Immigrants from Somalia (37.9%, a difference of 0.25%).
| Demographics | Rating | Rank | Bachelor's Degree |
| Colombians | 65.0 /100 | #162 | Good 38.4% |
| Peruvians | 63.4 /100 | #163 | Good 38.3% |
| Hungarians | 62.1 /100 | #164 | Good 38.3% |
| Sri Lankans | 59.1 /100 | #165 | Average 38.2% |
| Somalis | 58.6 /100 | #166 | Average 38.1% |
| Scottish | 56.6 /100 | #167 | Average 38.1% |
| Danes | 56.2 /100 | #168 | Average 38.1% |
| Ghanaians | 55.3 /100 | #169 | Average 38.0% |
| Czechs | 54.4 /100 | #170 | Average 38.0% |
| Bermudans | 54.2 /100 | #171 | Average 38.0% |
| Immigrants | Somalia | 52.8 /100 | #172 | Average 37.9% |
| Immigrants | Iraq | 52.5 /100 | #173 | Average 37.9% |
| Immigrants | Bangladesh | 50.0 /100 | #174 | Average 37.8% |
| Immigrants | Uruguay | 48.3 /100 | #175 | Average 37.8% |
| Costa Ricans | 47.6 /100 | #176 | Average 37.7% |
Demographics Similar to Immigrants from Austria by Bachelor's Degree
In terms of bachelor's degree, the demographic groups most similar to Immigrants from Austria are Immigrants from Bolivia (44.2%, a difference of 0.0%), Immigrants from Asia (44.3%, a difference of 0.19%), Immigrants from Serbia (44.1%, a difference of 0.19%), Immigrants from Spain (44.3%, a difference of 0.24%), and Paraguayan (44.0%, a difference of 0.37%).
| Demographics | Rating | Rank | Bachelor's Degree |
| Bolivians | 99.9 /100 | #47 | Exceptional 44.6% |
| Estonians | 99.9 /100 | #48 | Exceptional 44.6% |
| Immigrants | Norway | 99.9 /100 | #49 | Exceptional 44.5% |
| Immigrants | Greece | 99.9 /100 | #50 | Exceptional 44.5% |
| Asians | 99.9 /100 | #51 | Exceptional 44.4% |
| Immigrants | Spain | 99.9 /100 | #52 | Exceptional 44.3% |
| Immigrants | Asia | 99.9 /100 | #53 | Exceptional 44.3% |
| Immigrants | Austria | 99.9 /100 | #54 | Exceptional 44.2% |
| Immigrants | Bolivia | 99.9 /100 | #55 | Exceptional 44.2% |
| Immigrants | Serbia | 99.9 /100 | #56 | Exceptional 44.1% |
| Paraguayans | 99.9 /100 | #57 | Exceptional 44.0% |
| Immigrants | Czechoslovakia | 99.9 /100 | #58 | Exceptional 44.0% |
| Australians | 99.9 /100 | #59 | Exceptional 44.0% |
| New Zealanders | 99.9 /100 | #60 | Exceptional 44.0% |
| South Africans | 99.8 /100 | #61 | Exceptional 43.6% |