Scandinavian vs Immigrants from Austria Median Family Income
COMPARE
Scandinavian
Immigrants from Austria
Median Family Income
Median Family Income Comparison
Scandinavians
Immigrants from Austria
$104,410
MEDIAN FAMILY INCOME
70.8/ 100
METRIC RATING
158th/ 347
METRIC RANK
$116,830
MEDIAN FAMILY INCOME
99.9/ 100
METRIC RATING
47th/ 347
METRIC RANK
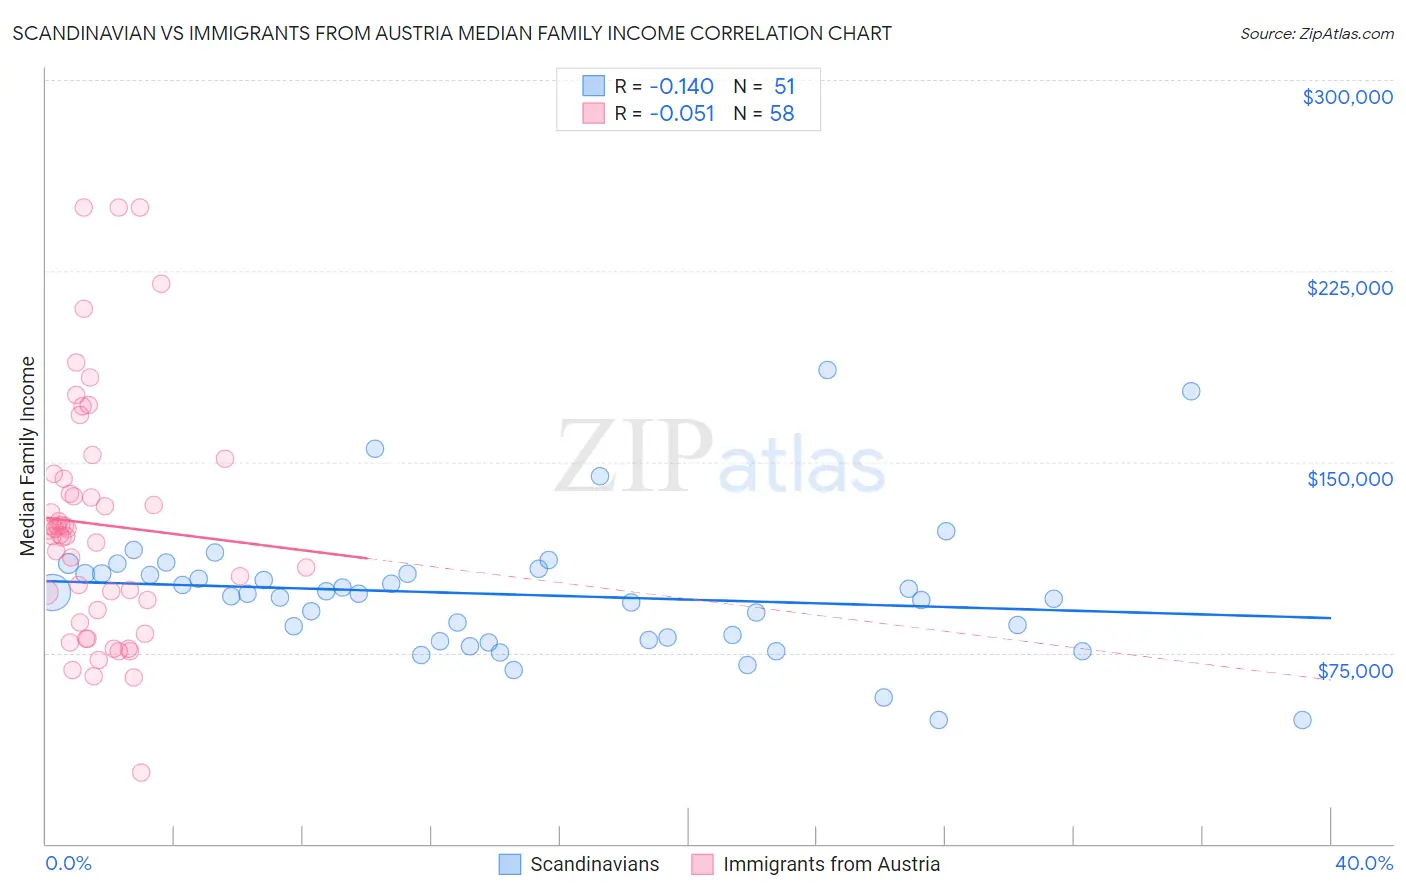
Scandinavian vs Immigrants from Austria Median Family Income Correlation Chart
The statistical analysis conducted on geographies consisting of 472,034,552 people shows a poor negative correlation between the proportion of Scandinavians and median family income in the United States with a correlation coefficient (R) of -0.140 and weighted average of $104,410. Similarly, the statistical analysis conducted on geographies consisting of 167,957,927 people shows a slight negative correlation between the proportion of Immigrants from Austria and median family income in the United States with a correlation coefficient (R) of -0.051 and weighted average of $116,830, a difference of 11.9%.
Median Family Income Correlation Summary
| Measurement | Scandinavian | Immigrants from Austria |
| Minimum | $48,750 | $28,077 |
| Maximum | $186,250 | $250,001 |
| Range | $137,500 | $221,924 |
| Mean | $97,868 | $125,494 |
| Median | $98,046 | $122,176 |
| Interquartile 25% (IQ1) | $80,113 | $91,605 |
| Interquartile 75% (IQ3) | $106,098 | $143,362 |
| Interquartile Range (IQR) | $25,985 | $51,756 |
| Standard Deviation (Sample) | $26,299 | $47,633 |
| Standard Deviation (Population) | $26,040 | $47,221 |
Similar Demographics by Median Family Income
Demographics Similar to Scandinavians by Median Family Income
In terms of median family income, the demographic groups most similar to Scandinavians are Swiss ($104,396, a difference of 0.010%), Moroccan ($104,488, a difference of 0.080%), Scottish ($104,288, a difference of 0.12%), Icelander ($104,282, a difference of 0.12%), and Basque ($104,760, a difference of 0.34%).
| Demographics | Rating | Rank | Median Family Income |
| Peruvians | 80.4 /100 | #151 | Excellent $105,444 |
| Immigrants | Albania | 79.1 /100 | #152 | Good $105,285 |
| Slavs | 77.9 /100 | #153 | Good $105,144 |
| Immigrants | Nepal | 76.3 /100 | #154 | Good $104,966 |
| Native Hawaiians | 75.8 /100 | #155 | Good $104,910 |
| Basques | 74.4 /100 | #156 | Good $104,760 |
| Moroccans | 71.6 /100 | #157 | Good $104,488 |
| Scandinavians | 70.8 /100 | #158 | Good $104,410 |
| Swiss | 70.7 /100 | #159 | Good $104,396 |
| Scottish | 69.5 /100 | #160 | Good $104,288 |
| Icelanders | 69.4 /100 | #161 | Good $104,282 |
| Immigrants | Sierra Leone | 66.2 /100 | #162 | Good $103,990 |
| Costa Ricans | 66.2 /100 | #163 | Good $103,989 |
| Sierra Leoneans | 64.7 /100 | #164 | Good $103,859 |
| Slovaks | 63.1 /100 | #165 | Good $103,729 |
Demographics Similar to Immigrants from Austria by Median Family Income
In terms of median family income, the demographic groups most similar to Immigrants from Austria are Immigrants from Russia ($116,942, a difference of 0.10%), Immigrants from Greece ($117,344, a difference of 0.44%), Immigrants from South Africa ($116,286, a difference of 0.47%), Chinese ($116,188, a difference of 0.55%), and Immigrants from Czechoslovakia ($116,165, a difference of 0.57%).
| Demographics | Rating | Rank | Median Family Income |
| Immigrants | Lithuania | 100.0 /100 | #40 | Exceptional $118,053 |
| Estonians | 100.0 /100 | #41 | Exceptional $118,013 |
| Immigrants | Bolivia | 100.0 /100 | #42 | Exceptional $117,912 |
| Bulgarians | 100.0 /100 | #43 | Exceptional $117,818 |
| Cambodians | 100.0 /100 | #44 | Exceptional $117,780 |
| Immigrants | Greece | 99.9 /100 | #45 | Exceptional $117,344 |
| Immigrants | Russia | 99.9 /100 | #46 | Exceptional $116,942 |
| Immigrants | Austria | 99.9 /100 | #47 | Exceptional $116,830 |
| Immigrants | South Africa | 99.9 /100 | #48 | Exceptional $116,286 |
| Chinese | 99.9 /100 | #49 | Exceptional $116,188 |
| Immigrants | Czechoslovakia | 99.9 /100 | #50 | Exceptional $116,165 |
| Immigrants | Malaysia | 99.9 /100 | #51 | Exceptional $115,880 |
| Maltese | 99.9 /100 | #52 | Exceptional $115,862 |
| Immigrants | Norway | 99.9 /100 | #53 | Exceptional $115,847 |
| Immigrants | Europe | 99.9 /100 | #54 | Exceptional $115,523 |