Scandinavian vs Cypriot College, Under 1 year
COMPARE
Scandinavian
Cypriot
College, Under 1 year
College, Under 1 year Comparison
Scandinavians
Cypriots
67.7%
COLLEGE, UNDER 1 YEAR
95.8/ 100
METRIC RATING
109th/ 347
METRIC RANK
72.0%
COLLEGE, UNDER 1 YEAR
100.0/ 100
METRIC RATING
13th/ 347
METRIC RANK
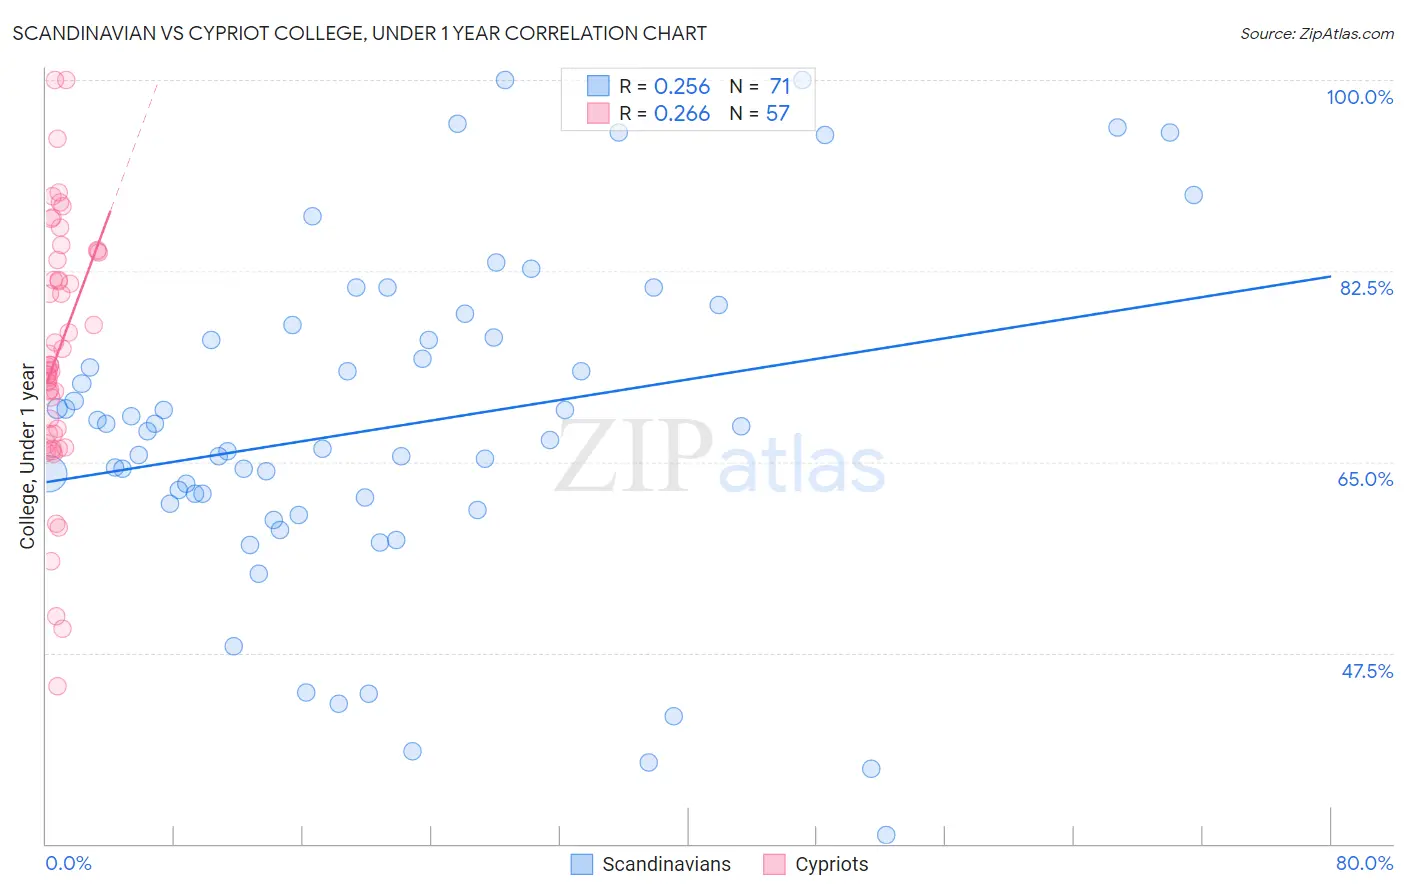
Scandinavian vs Cypriot College, Under 1 year Correlation Chart
The statistical analysis conducted on geographies consisting of 472,657,876 people shows a weak positive correlation between the proportion of Scandinavians and percentage of population with at least college, under 1 year education in the United States with a correlation coefficient (R) of 0.256 and weighted average of 67.7%. Similarly, the statistical analysis conducted on geographies consisting of 61,870,289 people shows a weak positive correlation between the proportion of Cypriots and percentage of population with at least college, under 1 year education in the United States with a correlation coefficient (R) of 0.266 and weighted average of 72.0%, a difference of 6.4%.
College, Under 1 year Correlation Summary
| Measurement | Scandinavian | Cypriot |
| Minimum | 30.8% | 44.5% |
| Maximum | 100.0% | 100.0% |
| Range | 69.2% | 55.5% |
| Mean | 68.2% | 74.9% |
| Median | 67.8% | 73.8% |
| Interquartile 25% (IQ1) | 61.1% | 67.6% |
| Interquartile 75% (IQ3) | 76.4% | 83.8% |
| Interquartile Range (IQR) | 15.3% | 16.2% |
| Standard Deviation (Sample) | 15.3% | 11.5% |
| Standard Deviation (Population) | 15.2% | 11.4% |
Similar Demographics by College, Under 1 year
Demographics Similar to Scandinavians by College, Under 1 year
In terms of college, under 1 year, the demographic groups most similar to Scandinavians are Assyrian/Chaldean/Syriac (67.7%, a difference of 0.0%), Ukrainian (67.7%, a difference of 0.0%), Macedonian (67.6%, a difference of 0.020%), Syrian (67.6%, a difference of 0.050%), and Immigrants from Egypt (67.7%, a difference of 0.060%).
| Demographics | Rating | Rank | College, Under 1 year |
| Palestinians | 96.9 /100 | #102 | Exceptional 67.9% |
| Carpatho Rusyns | 96.8 /100 | #103 | Exceptional 67.9% |
| Immigrants | Western Asia | 96.6 /100 | #104 | Exceptional 67.8% |
| Afghans | 96.6 /100 | #105 | Exceptional 67.8% |
| Immigrants | Croatia | 96.6 /100 | #106 | Exceptional 67.8% |
| Austrians | 96.4 /100 | #107 | Exceptional 67.8% |
| Immigrants | Egypt | 96.0 /100 | #108 | Exceptional 67.7% |
| Scandinavians | 95.8 /100 | #109 | Exceptional 67.7% |
| Assyrians/Chaldeans/Syriacs | 95.8 /100 | #110 | Exceptional 67.7% |
| Ukrainians | 95.8 /100 | #111 | Exceptional 67.7% |
| Macedonians | 95.7 /100 | #112 | Exceptional 67.6% |
| Syrians | 95.6 /100 | #113 | Exceptional 67.6% |
| Chileans | 95.3 /100 | #114 | Exceptional 67.6% |
| Basques | 95.2 /100 | #115 | Exceptional 67.6% |
| Immigrants | Nepal | 94.9 /100 | #116 | Exceptional 67.5% |
Demographics Similar to Cypriots by College, Under 1 year
In terms of college, under 1 year, the demographic groups most similar to Cypriots are Cambodian (71.9%, a difference of 0.12%), Burmese (71.9%, a difference of 0.12%), Immigrants from Japan (71.9%, a difference of 0.13%), Immigrants from South Central Asia (72.1%, a difference of 0.16%), and Immigrants from Sweden (72.1%, a difference of 0.16%).
| Demographics | Rating | Rank | College, Under 1 year |
| Immigrants | Taiwan | 100.0 /100 | #6 | Exceptional 74.2% |
| Okinawans | 100.0 /100 | #7 | Exceptional 73.7% |
| Thais | 100.0 /100 | #8 | Exceptional 73.4% |
| Immigrants | Australia | 100.0 /100 | #9 | Exceptional 72.7% |
| Immigrants | Israel | 100.0 /100 | #10 | Exceptional 72.3% |
| Immigrants | South Central Asia | 100.0 /100 | #11 | Exceptional 72.1% |
| Immigrants | Sweden | 100.0 /100 | #12 | Exceptional 72.1% |
| Cypriots | 100.0 /100 | #13 | Exceptional 72.0% |
| Cambodians | 100.0 /100 | #14 | Exceptional 71.9% |
| Burmese | 100.0 /100 | #15 | Exceptional 71.9% |
| Immigrants | Japan | 100.0 /100 | #16 | Exceptional 71.9% |
| Eastern Europeans | 100.0 /100 | #17 | Exceptional 71.8% |
| Immigrants | Switzerland | 100.0 /100 | #18 | Exceptional 71.7% |
| Latvians | 100.0 /100 | #19 | Exceptional 71.6% |
| Immigrants | Korea | 100.0 /100 | #20 | Exceptional 71.6% |