Scandinavian vs Choctaw College, Under 1 year
COMPARE
Scandinavian
Choctaw
College, Under 1 year
College, Under 1 year Comparison
Scandinavians
Choctaw
67.7%
COLLEGE, UNDER 1 YEAR
95.8/ 100
METRIC RATING
109th/ 347
METRIC RANK
59.3%
COLLEGE, UNDER 1 YEAR
0.0/ 100
METRIC RATING
289th/ 347
METRIC RANK
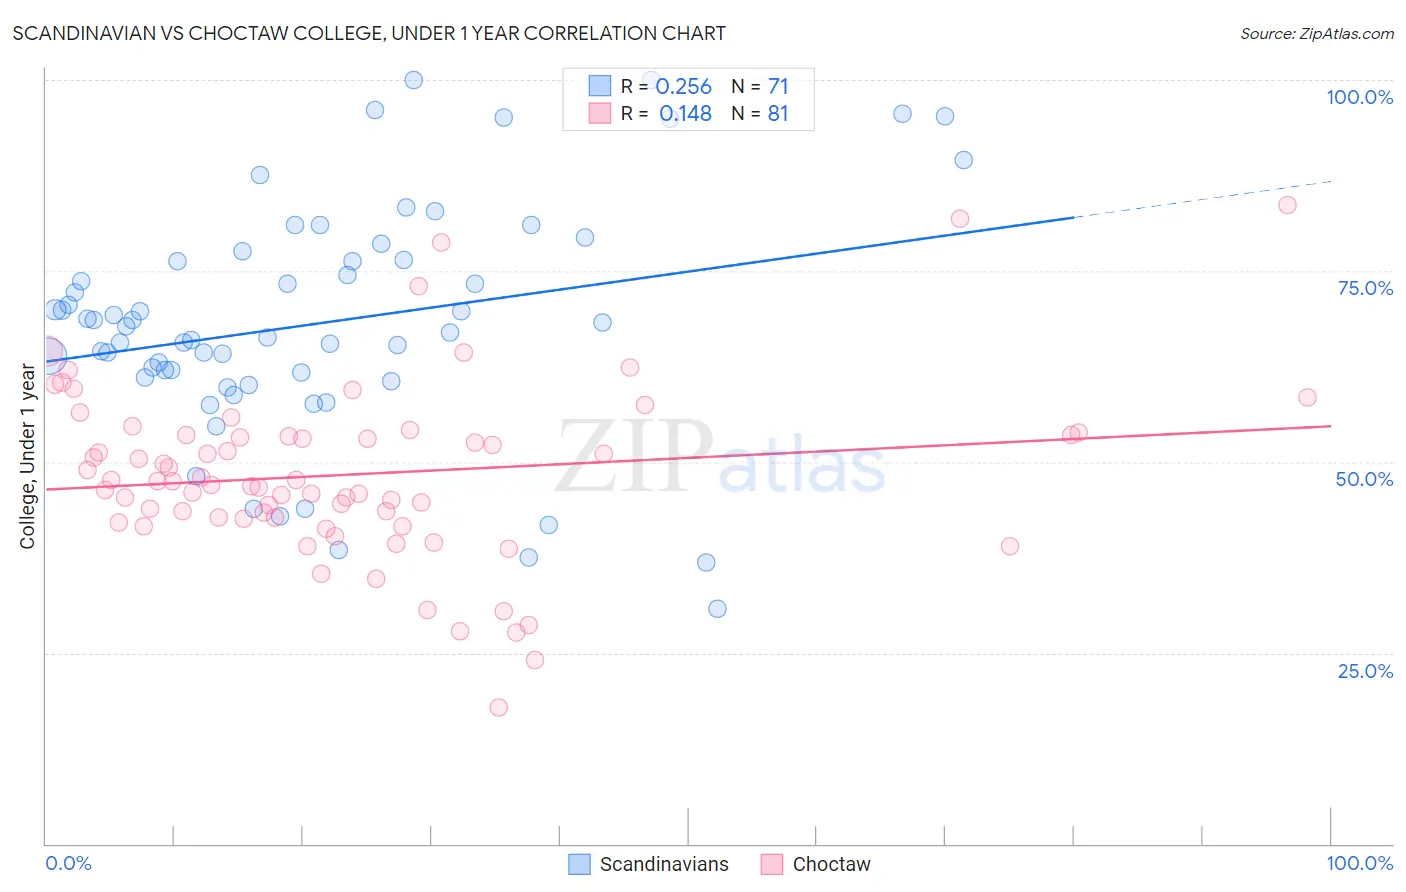
Scandinavian vs Choctaw College, Under 1 year Correlation Chart
The statistical analysis conducted on geographies consisting of 472,657,876 people shows a weak positive correlation between the proportion of Scandinavians and percentage of population with at least college, under 1 year education in the United States with a correlation coefficient (R) of 0.256 and weighted average of 67.7%. Similarly, the statistical analysis conducted on geographies consisting of 269,741,683 people shows a poor positive correlation between the proportion of Choctaw and percentage of population with at least college, under 1 year education in the United States with a correlation coefficient (R) of 0.148 and weighted average of 59.3%, a difference of 14.0%.
College, Under 1 year Correlation Summary
| Measurement | Scandinavian | Choctaw |
| Minimum | 30.8% | 17.8% |
| Maximum | 100.0% | 83.7% |
| Range | 69.2% | 65.9% |
| Mean | 68.2% | 48.4% |
| Median | 67.8% | 47.4% |
| Interquartile 25% (IQ1) | 61.1% | 42.6% |
| Interquartile 75% (IQ3) | 76.4% | 53.5% |
| Interquartile Range (IQR) | 15.3% | 10.9% |
| Standard Deviation (Sample) | 15.3% | 11.6% |
| Standard Deviation (Population) | 15.2% | 11.5% |
Similar Demographics by College, Under 1 year
Demographics Similar to Scandinavians by College, Under 1 year
In terms of college, under 1 year, the demographic groups most similar to Scandinavians are Assyrian/Chaldean/Syriac (67.7%, a difference of 0.0%), Ukrainian (67.7%, a difference of 0.0%), Macedonian (67.6%, a difference of 0.020%), Syrian (67.6%, a difference of 0.050%), and Immigrants from Egypt (67.7%, a difference of 0.060%).
| Demographics | Rating | Rank | College, Under 1 year |
| Palestinians | 96.9 /100 | #102 | Exceptional 67.9% |
| Carpatho Rusyns | 96.8 /100 | #103 | Exceptional 67.9% |
| Immigrants | Western Asia | 96.6 /100 | #104 | Exceptional 67.8% |
| Afghans | 96.6 /100 | #105 | Exceptional 67.8% |
| Immigrants | Croatia | 96.6 /100 | #106 | Exceptional 67.8% |
| Austrians | 96.4 /100 | #107 | Exceptional 67.8% |
| Immigrants | Egypt | 96.0 /100 | #108 | Exceptional 67.7% |
| Scandinavians | 95.8 /100 | #109 | Exceptional 67.7% |
| Assyrians/Chaldeans/Syriacs | 95.8 /100 | #110 | Exceptional 67.7% |
| Ukrainians | 95.8 /100 | #111 | Exceptional 67.7% |
| Macedonians | 95.7 /100 | #112 | Exceptional 67.6% |
| Syrians | 95.6 /100 | #113 | Exceptional 67.6% |
| Chileans | 95.3 /100 | #114 | Exceptional 67.6% |
| Basques | 95.2 /100 | #115 | Exceptional 67.6% |
| Immigrants | Nepal | 94.9 /100 | #116 | Exceptional 67.5% |
Demographics Similar to Choctaw by College, Under 1 year
In terms of college, under 1 year, the demographic groups most similar to Choctaw are Ecuadorian (59.3%, a difference of 0.040%), Black/African American (59.4%, a difference of 0.070%), Creek (59.3%, a difference of 0.13%), Sioux (59.4%, a difference of 0.17%), and Nicaraguan (59.2%, a difference of 0.17%).
| Demographics | Rating | Rank | College, Under 1 year |
| Belizeans | 0.1 /100 | #282 | Tragic 60.1% |
| Immigrants | Jamaica | 0.0 /100 | #283 | Tragic 59.7% |
| Immigrants | St. Vincent and the Grenadines | 0.0 /100 | #284 | Tragic 59.6% |
| Paiute | 0.0 /100 | #285 | Tragic 59.6% |
| British West Indians | 0.0 /100 | #286 | Tragic 59.5% |
| Sioux | 0.0 /100 | #287 | Tragic 59.4% |
| Blacks/African Americans | 0.0 /100 | #288 | Tragic 59.4% |
| Choctaw | 0.0 /100 | #289 | Tragic 59.3% |
| Ecuadorians | 0.0 /100 | #290 | Tragic 59.3% |
| Creek | 0.0 /100 | #291 | Tragic 59.3% |
| Nicaraguans | 0.0 /100 | #292 | Tragic 59.2% |
| Seminole | 0.0 /100 | #293 | Tragic 59.1% |
| Immigrants | Belize | 0.0 /100 | #294 | Tragic 59.1% |
| Immigrants | Grenada | 0.0 /100 | #295 | Tragic 59.1% |
| Central American Indians | 0.0 /100 | #296 | Tragic 59.0% |