Icelander vs Cypriot College, Under 1 year
COMPARE
Icelander
Cypriot
College, Under 1 year
College, Under 1 year Comparison
Icelanders
Cypriots
68.3%
COLLEGE, UNDER 1 YEAR
98.1/ 100
METRIC RATING
90th/ 347
METRIC RANK
72.0%
COLLEGE, UNDER 1 YEAR
100.0/ 100
METRIC RATING
13th/ 347
METRIC RANK
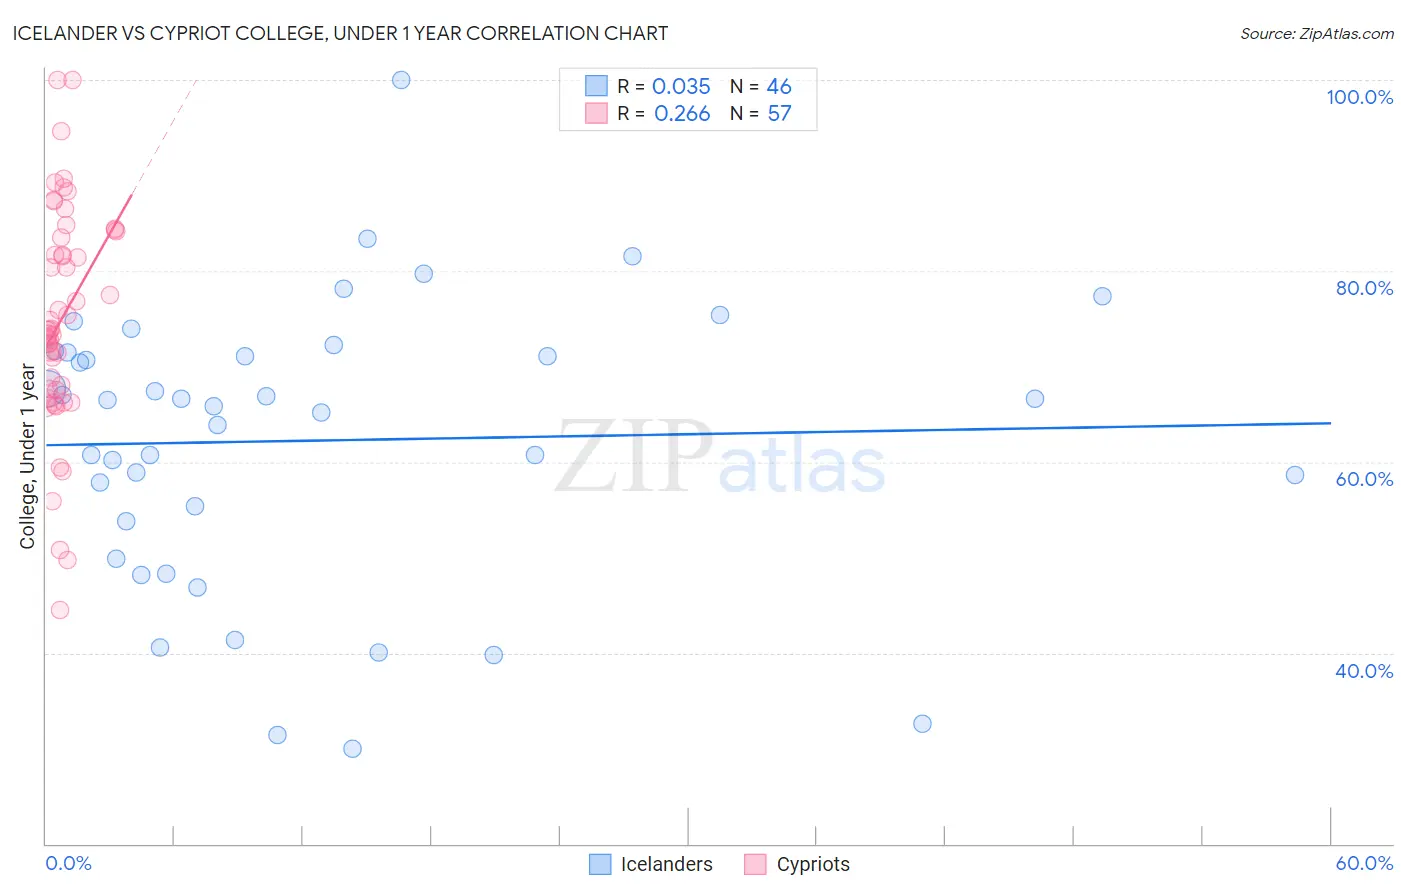
Icelander vs Cypriot College, Under 1 year Correlation Chart
The statistical analysis conducted on geographies consisting of 159,668,975 people shows no correlation between the proportion of Icelanders and percentage of population with at least college, under 1 year education in the United States with a correlation coefficient (R) of 0.035 and weighted average of 68.3%. Similarly, the statistical analysis conducted on geographies consisting of 61,870,289 people shows a weak positive correlation between the proportion of Cypriots and percentage of population with at least college, under 1 year education in the United States with a correlation coefficient (R) of 0.266 and weighted average of 72.0%, a difference of 5.4%.
College, Under 1 year Correlation Summary
| Measurement | Icelander | Cypriot |
| Minimum | 30.0% | 44.5% |
| Maximum | 100.0% | 100.0% |
| Range | 70.0% | 55.5% |
| Mean | 62.2% | 74.9% |
| Median | 66.2% | 73.8% |
| Interquartile 25% (IQ1) | 53.8% | 67.6% |
| Interquartile 75% (IQ3) | 71.5% | 83.8% |
| Interquartile Range (IQR) | 17.7% | 16.2% |
| Standard Deviation (Sample) | 14.9% | 11.5% |
| Standard Deviation (Population) | 14.7% | 11.4% |
Similar Demographics by College, Under 1 year
Demographics Similar to Icelanders by College, Under 1 year
In terms of college, under 1 year, the demographic groups most similar to Icelanders are European (68.2%, a difference of 0.030%), Luxembourger (68.2%, a difference of 0.040%), Ethiopian (68.3%, a difference of 0.060%), Croatian (68.3%, a difference of 0.070%), and Chinese (68.3%, a difference of 0.090%).
| Demographics | Rating | Rank | College, Under 1 year |
| Argentineans | 98.4 /100 | #83 | Exceptional 68.4% |
| Immigrants | Hungary | 98.3 /100 | #84 | Exceptional 68.3% |
| Egyptians | 98.3 /100 | #85 | Exceptional 68.3% |
| Immigrants | Lebanon | 98.3 /100 | #86 | Exceptional 68.3% |
| Chinese | 98.3 /100 | #87 | Exceptional 68.3% |
| Croatians | 98.2 /100 | #88 | Exceptional 68.3% |
| Ethiopians | 98.2 /100 | #89 | Exceptional 68.3% |
| Icelanders | 98.1 /100 | #90 | Exceptional 68.3% |
| Europeans | 98.1 /100 | #91 | Exceptional 68.2% |
| Luxembourgers | 98.1 /100 | #92 | Exceptional 68.2% |
| Romanians | 97.9 /100 | #93 | Exceptional 68.2% |
| Armenians | 97.7 /100 | #94 | Exceptional 68.1% |
| Immigrants | Pakistan | 97.5 /100 | #95 | Exceptional 68.0% |
| Jordanians | 97.4 /100 | #96 | Exceptional 68.0% |
| Immigrants | Ethiopia | 97.3 /100 | #97 | Exceptional 68.0% |
Demographics Similar to Cypriots by College, Under 1 year
In terms of college, under 1 year, the demographic groups most similar to Cypriots are Cambodian (71.9%, a difference of 0.12%), Burmese (71.9%, a difference of 0.12%), Immigrants from Japan (71.9%, a difference of 0.13%), Immigrants from South Central Asia (72.1%, a difference of 0.16%), and Immigrants from Sweden (72.1%, a difference of 0.16%).
| Demographics | Rating | Rank | College, Under 1 year |
| Immigrants | Taiwan | 100.0 /100 | #6 | Exceptional 74.2% |
| Okinawans | 100.0 /100 | #7 | Exceptional 73.7% |
| Thais | 100.0 /100 | #8 | Exceptional 73.4% |
| Immigrants | Australia | 100.0 /100 | #9 | Exceptional 72.7% |
| Immigrants | Israel | 100.0 /100 | #10 | Exceptional 72.3% |
| Immigrants | South Central Asia | 100.0 /100 | #11 | Exceptional 72.1% |
| Immigrants | Sweden | 100.0 /100 | #12 | Exceptional 72.1% |
| Cypriots | 100.0 /100 | #13 | Exceptional 72.0% |
| Cambodians | 100.0 /100 | #14 | Exceptional 71.9% |
| Burmese | 100.0 /100 | #15 | Exceptional 71.9% |
| Immigrants | Japan | 100.0 /100 | #16 | Exceptional 71.9% |
| Eastern Europeans | 100.0 /100 | #17 | Exceptional 71.8% |
| Immigrants | Switzerland | 100.0 /100 | #18 | Exceptional 71.7% |
| Latvians | 100.0 /100 | #19 | Exceptional 71.6% |
| Immigrants | Korea | 100.0 /100 | #20 | Exceptional 71.6% |