Immigrants from Malaysia vs Cypriot College, Under 1 year
COMPARE
Immigrants from Malaysia
Cypriot
College, Under 1 year
College, Under 1 year Comparison
Immigrants from Malaysia
Cypriots
69.3%
COLLEGE, UNDER 1 YEAR
99.6/ 100
METRIC RATING
58th/ 347
METRIC RANK
72.0%
COLLEGE, UNDER 1 YEAR
100.0/ 100
METRIC RATING
13th/ 347
METRIC RANK
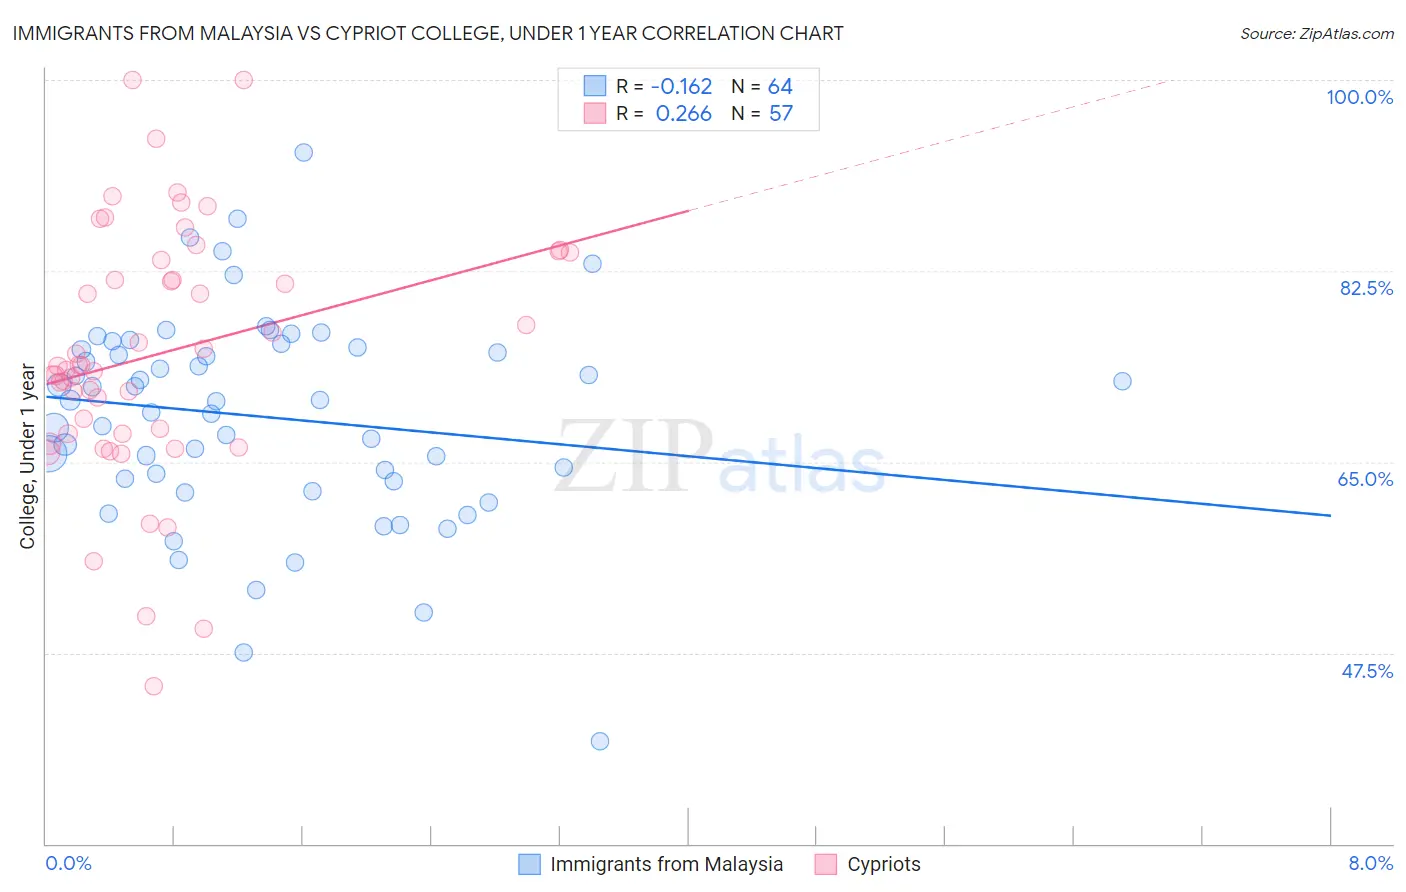
Immigrants from Malaysia vs Cypriot College, Under 1 year Correlation Chart
The statistical analysis conducted on geographies consisting of 197,973,854 people shows a poor negative correlation between the proportion of Immigrants from Malaysia and percentage of population with at least college, under 1 year education in the United States with a correlation coefficient (R) of -0.162 and weighted average of 69.3%. Similarly, the statistical analysis conducted on geographies consisting of 61,870,289 people shows a weak positive correlation between the proportion of Cypriots and percentage of population with at least college, under 1 year education in the United States with a correlation coefficient (R) of 0.266 and weighted average of 72.0%, a difference of 3.8%.
College, Under 1 year Correlation Summary
| Measurement | Immigrants from Malaysia | Cypriot |
| Minimum | 39.4% | 44.5% |
| Maximum | 93.4% | 100.0% |
| Range | 54.0% | 55.5% |
| Mean | 69.1% | 74.9% |
| Median | 70.6% | 73.8% |
| Interquartile 25% (IQ1) | 63.3% | 67.6% |
| Interquartile 75% (IQ3) | 75.4% | 83.8% |
| Interquartile Range (IQR) | 12.1% | 16.2% |
| Standard Deviation (Sample) | 9.6% | 11.5% |
| Standard Deviation (Population) | 9.6% | 11.4% |
Similar Demographics by College, Under 1 year
Demographics Similar to Immigrants from Malaysia by College, Under 1 year
In terms of college, under 1 year, the demographic groups most similar to Immigrants from Malaysia are Asian (69.4%, a difference of 0.10%), Immigrants from Scotland (69.4%, a difference of 0.12%), Immigrants from Serbia (69.3%, a difference of 0.13%), Immigrants from Asia (69.2%, a difference of 0.22%), and Maltese (69.5%, a difference of 0.24%).
| Demographics | Rating | Rank | College, Under 1 year |
| Mongolians | 99.8 /100 | #51 | Exceptional 69.9% |
| Immigrants | Russia | 99.8 /100 | #52 | Exceptional 69.9% |
| South Africans | 99.7 /100 | #53 | Exceptional 69.7% |
| Immigrants | Czechoslovakia | 99.7 /100 | #54 | Exceptional 69.6% |
| Maltese | 99.7 /100 | #55 | Exceptional 69.5% |
| Immigrants | Scotland | 99.6 /100 | #56 | Exceptional 69.4% |
| Asians | 99.6 /100 | #57 | Exceptional 69.4% |
| Immigrants | Malaysia | 99.6 /100 | #58 | Exceptional 69.3% |
| Immigrants | Serbia | 99.5 /100 | #59 | Exceptional 69.3% |
| Immigrants | Asia | 99.5 /100 | #60 | Exceptional 69.2% |
| Immigrants | Kazakhstan | 99.5 /100 | #61 | Exceptional 69.2% |
| Immigrants | Belarus | 99.5 /100 | #62 | Exceptional 69.2% |
| Immigrants | Canada | 99.4 /100 | #63 | Exceptional 69.1% |
| Northern Europeans | 99.4 /100 | #64 | Exceptional 69.0% |
| Immigrants | Moldova | 99.3 /100 | #65 | Exceptional 69.0% |
Demographics Similar to Cypriots by College, Under 1 year
In terms of college, under 1 year, the demographic groups most similar to Cypriots are Cambodian (71.9%, a difference of 0.12%), Burmese (71.9%, a difference of 0.12%), Immigrants from Japan (71.9%, a difference of 0.13%), Immigrants from South Central Asia (72.1%, a difference of 0.16%), and Immigrants from Sweden (72.1%, a difference of 0.16%).
| Demographics | Rating | Rank | College, Under 1 year |
| Immigrants | Taiwan | 100.0 /100 | #6 | Exceptional 74.2% |
| Okinawans | 100.0 /100 | #7 | Exceptional 73.7% |
| Thais | 100.0 /100 | #8 | Exceptional 73.4% |
| Immigrants | Australia | 100.0 /100 | #9 | Exceptional 72.7% |
| Immigrants | Israel | 100.0 /100 | #10 | Exceptional 72.3% |
| Immigrants | South Central Asia | 100.0 /100 | #11 | Exceptional 72.1% |
| Immigrants | Sweden | 100.0 /100 | #12 | Exceptional 72.1% |
| Cypriots | 100.0 /100 | #13 | Exceptional 72.0% |
| Cambodians | 100.0 /100 | #14 | Exceptional 71.9% |
| Burmese | 100.0 /100 | #15 | Exceptional 71.9% |
| Immigrants | Japan | 100.0 /100 | #16 | Exceptional 71.9% |
| Eastern Europeans | 100.0 /100 | #17 | Exceptional 71.8% |
| Immigrants | Switzerland | 100.0 /100 | #18 | Exceptional 71.7% |
| Latvians | 100.0 /100 | #19 | Exceptional 71.6% |
| Immigrants | Korea | 100.0 /100 | #20 | Exceptional 71.6% |