Scandinavian vs Irish College, Under 1 year
COMPARE
Scandinavian
Irish
College, Under 1 year
College, Under 1 year Comparison
Scandinavians
Irish
67.7%
COLLEGE, UNDER 1 YEAR
95.8/ 100
METRIC RATING
109th/ 347
METRIC RANK
66.0%
COLLEGE, UNDER 1 YEAR
70.3/ 100
METRIC RATING
155th/ 347
METRIC RANK
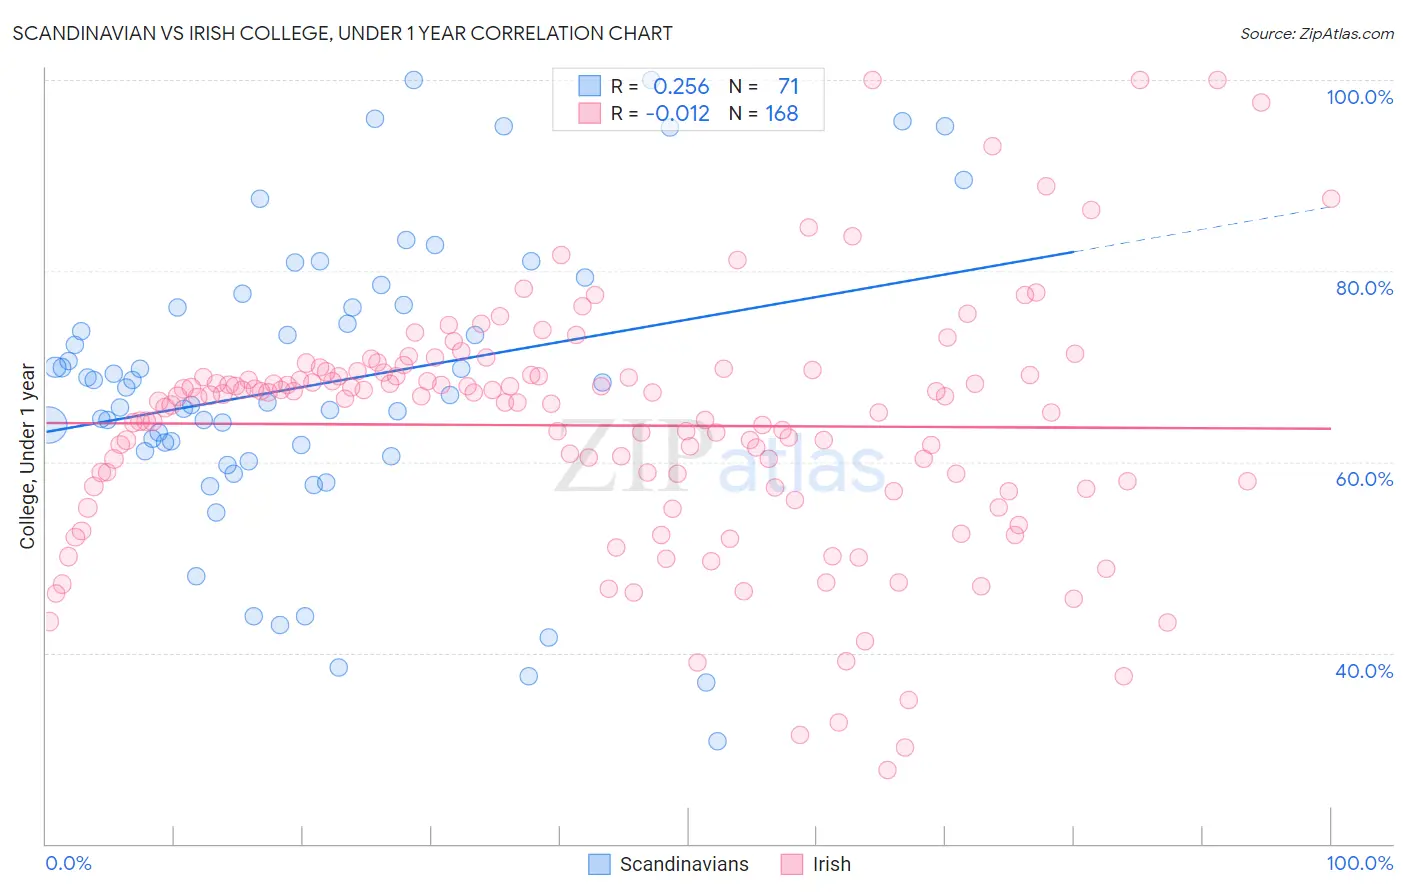
Scandinavian vs Irish College, Under 1 year Correlation Chart
The statistical analysis conducted on geographies consisting of 472,657,876 people shows a weak positive correlation between the proportion of Scandinavians and percentage of population with at least college, under 1 year education in the United States with a correlation coefficient (R) of 0.256 and weighted average of 67.7%. Similarly, the statistical analysis conducted on geographies consisting of 580,693,587 people shows no correlation between the proportion of Irish and percentage of population with at least college, under 1 year education in the United States with a correlation coefficient (R) of -0.012 and weighted average of 66.0%, a difference of 2.5%.
College, Under 1 year Correlation Summary
| Measurement | Scandinavian | Irish |
| Minimum | 30.8% | 27.7% |
| Maximum | 100.0% | 100.0% |
| Range | 69.2% | 72.3% |
| Mean | 68.2% | 63.8% |
| Median | 67.8% | 66.7% |
| Interquartile 25% (IQ1) | 61.1% | 57.4% |
| Interquartile 75% (IQ3) | 76.4% | 69.1% |
| Interquartile Range (IQR) | 15.3% | 11.7% |
| Standard Deviation (Sample) | 15.3% | 12.6% |
| Standard Deviation (Population) | 15.2% | 12.6% |
Similar Demographics by College, Under 1 year
Demographics Similar to Scandinavians by College, Under 1 year
In terms of college, under 1 year, the demographic groups most similar to Scandinavians are Assyrian/Chaldean/Syriac (67.7%, a difference of 0.0%), Ukrainian (67.7%, a difference of 0.0%), Macedonian (67.6%, a difference of 0.020%), Syrian (67.6%, a difference of 0.050%), and Immigrants from Egypt (67.7%, a difference of 0.060%).
| Demographics | Rating | Rank | College, Under 1 year |
| Palestinians | 96.9 /100 | #102 | Exceptional 67.9% |
| Carpatho Rusyns | 96.8 /100 | #103 | Exceptional 67.9% |
| Immigrants | Western Asia | 96.6 /100 | #104 | Exceptional 67.8% |
| Afghans | 96.6 /100 | #105 | Exceptional 67.8% |
| Immigrants | Croatia | 96.6 /100 | #106 | Exceptional 67.8% |
| Austrians | 96.4 /100 | #107 | Exceptional 67.8% |
| Immigrants | Egypt | 96.0 /100 | #108 | Exceptional 67.7% |
| Scandinavians | 95.8 /100 | #109 | Exceptional 67.7% |
| Assyrians/Chaldeans/Syriacs | 95.8 /100 | #110 | Exceptional 67.7% |
| Ukrainians | 95.8 /100 | #111 | Exceptional 67.7% |
| Macedonians | 95.7 /100 | #112 | Exceptional 67.6% |
| Syrians | 95.6 /100 | #113 | Exceptional 67.6% |
| Chileans | 95.3 /100 | #114 | Exceptional 67.6% |
| Basques | 95.2 /100 | #115 | Exceptional 67.6% |
| Immigrants | Nepal | 94.9 /100 | #116 | Exceptional 67.5% |
Demographics Similar to Irish by College, Under 1 year
In terms of college, under 1 year, the demographic groups most similar to Irish are Welsh (66.0%, a difference of 0.020%), Immigrants from Eritrea (66.1%, a difference of 0.090%), Sierra Leonean (66.0%, a difference of 0.12%), Celtic (65.9%, a difference of 0.15%), and Belgian (66.2%, a difference of 0.18%).
| Demographics | Rating | Rank | College, Under 1 year |
| Taiwanese | 78.6 /100 | #148 | Good 66.4% |
| Immigrants | Venezuela | 77.9 /100 | #149 | Good 66.3% |
| Immigrants | Iraq | 77.1 /100 | #150 | Good 66.3% |
| Immigrants | Sudan | 76.0 /100 | #151 | Good 66.2% |
| Sudanese | 74.1 /100 | #152 | Good 66.2% |
| Belgians | 73.7 /100 | #153 | Good 66.2% |
| Immigrants | Eritrea | 71.9 /100 | #154 | Good 66.1% |
| Irish | 70.3 /100 | #155 | Good 66.0% |
| Welsh | 69.9 /100 | #156 | Good 66.0% |
| Sierra Leoneans | 67.8 /100 | #157 | Good 66.0% |
| Celtics | 67.3 /100 | #158 | Good 65.9% |
| Tlingit-Haida | 66.4 /100 | #159 | Good 65.9% |
| Albanians | 66.1 /100 | #160 | Good 65.9% |
| Brazilians | 66.0 /100 | #161 | Good 65.9% |
| Koreans | 65.3 /100 | #162 | Good 65.9% |