Immigrants from Congo vs Belizean Associate's Degree
COMPARE
Immigrants from Congo
Belizean
Associate's Degree
Associate's Degree Comparison
Immigrants from Congo
Belizeans
41.8%
ASSOCIATE'S DEGREE
0.5/ 100
METRIC RATING
256th/ 347
METRIC RANK
40.6%
ASSOCIATE'S DEGREE
0.1/ 100
METRIC RATING
272nd/ 347
METRIC RANK
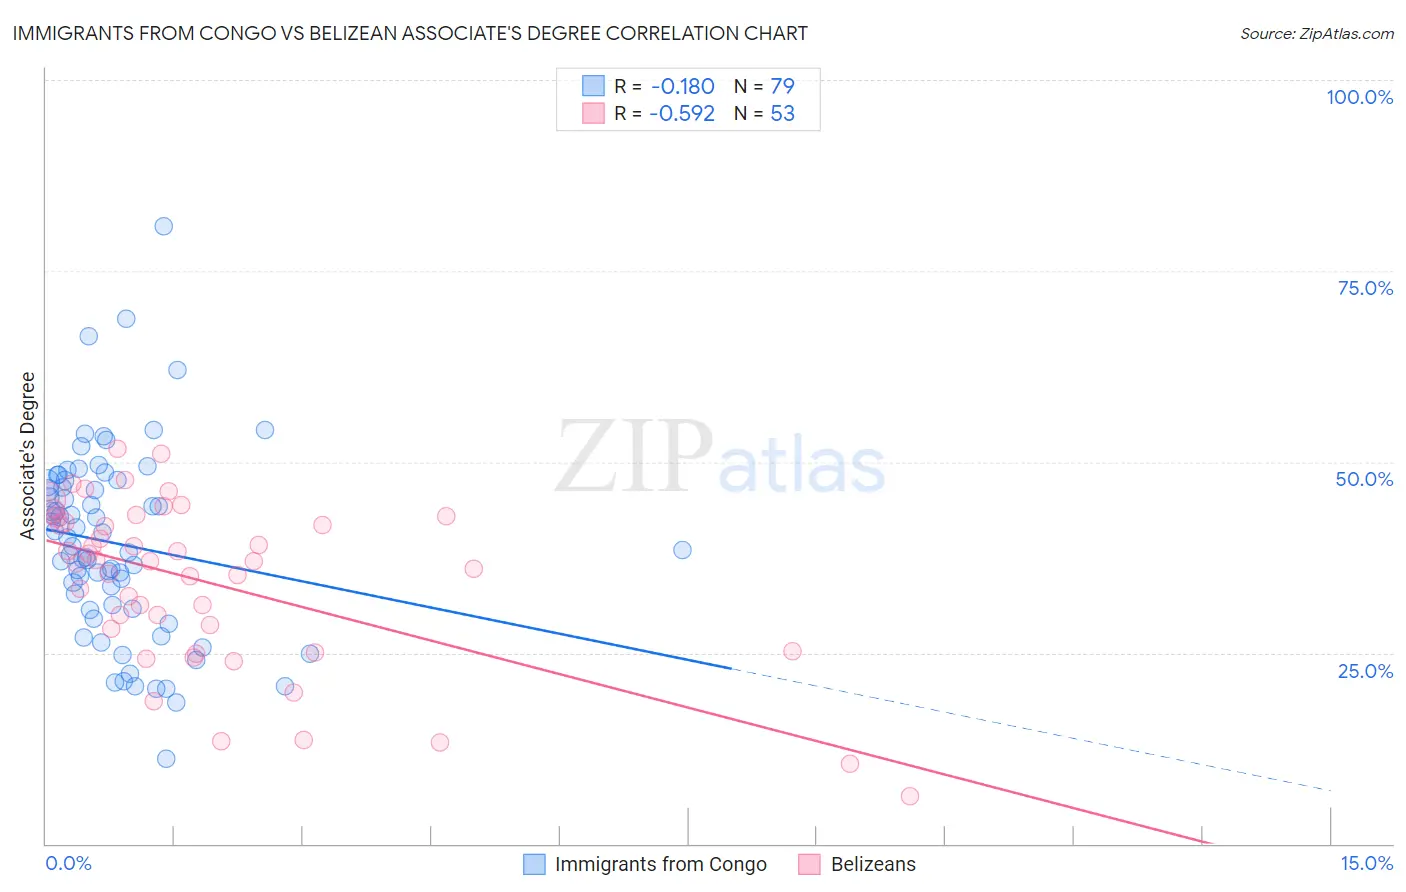
Immigrants from Congo vs Belizean Associate's Degree Correlation Chart
The statistical analysis conducted on geographies consisting of 92,128,730 people shows a poor negative correlation between the proportion of Immigrants from Congo and percentage of population with at least associate's degree education in the United States with a correlation coefficient (R) of -0.180 and weighted average of 41.8%. Similarly, the statistical analysis conducted on geographies consisting of 144,216,581 people shows a substantial negative correlation between the proportion of Belizeans and percentage of population with at least associate's degree education in the United States with a correlation coefficient (R) of -0.592 and weighted average of 40.6%, a difference of 2.9%.
Associate's Degree Correlation Summary
| Measurement | Immigrants from Congo | Belizean |
| Minimum | 11.1% | 6.2% |
| Maximum | 80.9% | 51.7% |
| Range | 69.7% | 45.5% |
| Mean | 39.3% | 34.2% |
| Median | 39.0% | 37.0% |
| Interquartile 25% (IQ1) | 30.7% | 26.6% |
| Interquartile 75% (IQ3) | 47.3% | 42.4% |
| Interquartile Range (IQR) | 16.6% | 15.7% |
| Standard Deviation (Sample) | 12.3% | 10.8% |
| Standard Deviation (Population) | 12.2% | 10.7% |
Demographics Similar to Immigrants from Congo and Belizeans by Associate's Degree
In terms of associate's degree, the demographic groups most similar to Immigrants from Congo are Spanish American (41.8%, a difference of 0.060%), Immigrants from Guyana (41.8%, a difference of 0.12%), Cuban (41.9%, a difference of 0.21%), Japanese (41.7%, a difference of 0.27%), and Malaysian (41.6%, a difference of 0.38%). Similarly, the demographic groups most similar to Belizeans are Immigrants from Laos (40.7%, a difference of 0.070%), Chippewa (40.7%, a difference of 0.25%), Puget Sound Salish (40.5%, a difference of 0.29%), American (40.8%, a difference of 0.30%), and Immigrants from Dominica (40.5%, a difference of 0.43%).
| Demographics | Rating | Rank | Associate's Degree |
| Cubans | 0.6 /100 | #254 | Tragic 41.9% |
| Immigrants | Guyana | 0.5 /100 | #255 | Tragic 41.8% |
| Immigrants | Congo | 0.5 /100 | #256 | Tragic 41.8% |
| Spanish Americans | 0.5 /100 | #257 | Tragic 41.8% |
| Japanese | 0.5 /100 | #258 | Tragic 41.7% |
| Malaysians | 0.4 /100 | #259 | Tragic 41.6% |
| Marshallese | 0.4 /100 | #260 | Tragic 41.6% |
| Nicaraguans | 0.4 /100 | #261 | Tragic 41.5% |
| Bahamians | 0.4 /100 | #262 | Tragic 41.5% |
| Immigrants | Jamaica | 0.3 /100 | #263 | Tragic 41.5% |
| Osage | 0.3 /100 | #264 | Tragic 41.5% |
| Africans | 0.2 /100 | #265 | Tragic 41.1% |
| Samoans | 0.2 /100 | #266 | Tragic 41.1% |
| Hawaiians | 0.2 /100 | #267 | Tragic 40.9% |
| Central American Indians | 0.2 /100 | #268 | Tragic 40.8% |
| Americans | 0.2 /100 | #269 | Tragic 40.8% |
| Chippewa | 0.2 /100 | #270 | Tragic 40.7% |
| Immigrants | Laos | 0.1 /100 | #271 | Tragic 40.7% |
| Belizeans | 0.1 /100 | #272 | Tragic 40.6% |
| Puget Sound Salish | 0.1 /100 | #273 | Tragic 40.5% |
| Immigrants | Dominica | 0.1 /100 | #274 | Tragic 40.5% |