Cree vs Belizean Associate's Degree
COMPARE
Cree
Belizean
Associate's Degree
Associate's Degree Comparison
Cree
Belizeans
42.5%
ASSOCIATE'S DEGREE
1.2/ 100
METRIC RATING
240th/ 347
METRIC RANK
40.6%
ASSOCIATE'S DEGREE
0.1/ 100
METRIC RATING
272nd/ 347
METRIC RANK
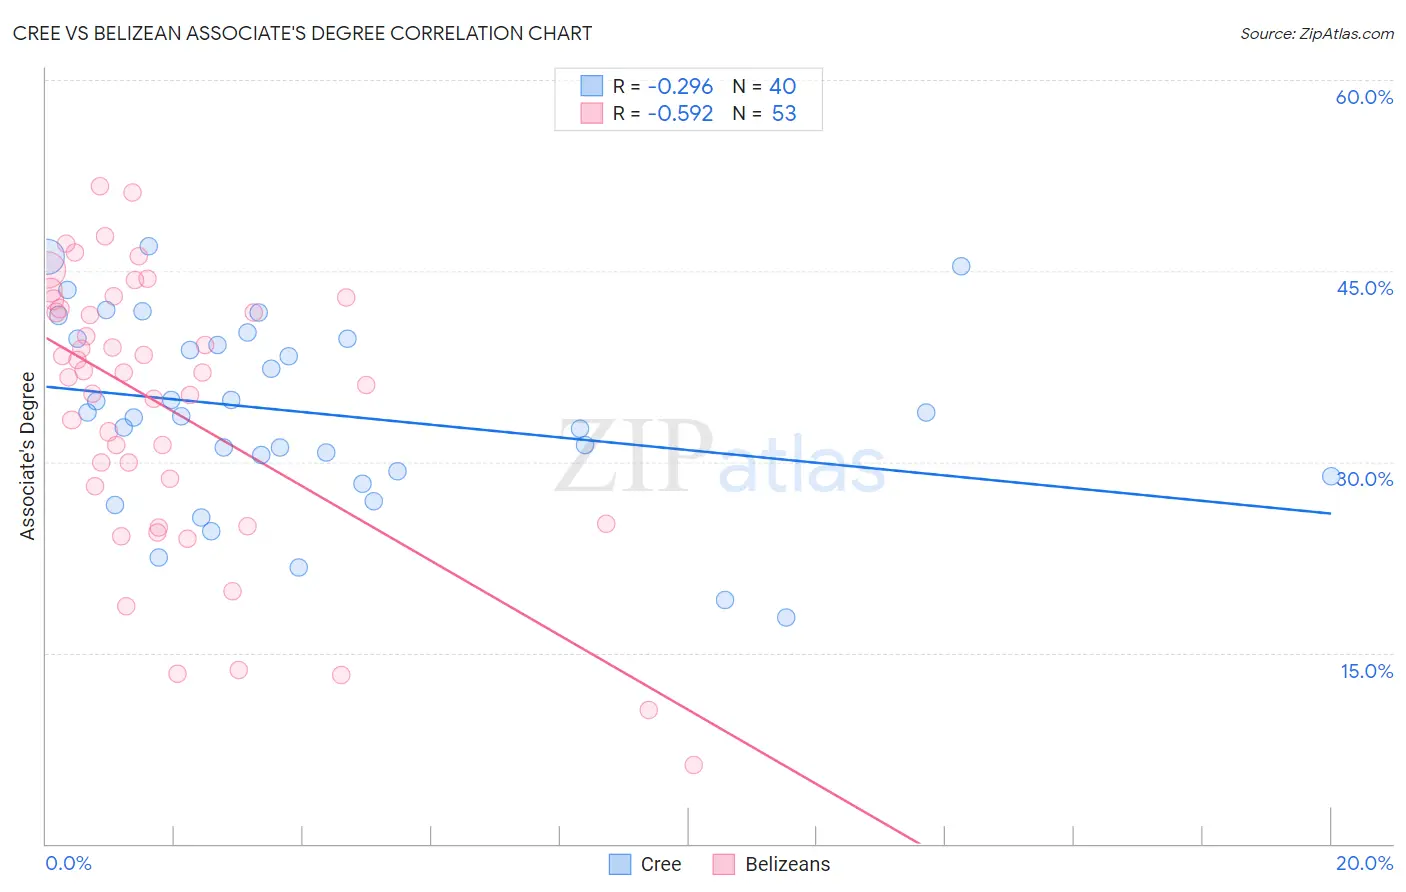
Cree vs Belizean Associate's Degree Correlation Chart
The statistical analysis conducted on geographies consisting of 76,211,414 people shows a weak negative correlation between the proportion of Cree and percentage of population with at least associate's degree education in the United States with a correlation coefficient (R) of -0.296 and weighted average of 42.5%. Similarly, the statistical analysis conducted on geographies consisting of 144,216,581 people shows a substantial negative correlation between the proportion of Belizeans and percentage of population with at least associate's degree education in the United States with a correlation coefficient (R) of -0.592 and weighted average of 40.6%, a difference of 4.6%.
Associate's Degree Correlation Summary
| Measurement | Cree | Belizean |
| Minimum | 17.8% | 6.2% |
| Maximum | 46.9% | 51.7% |
| Range | 29.1% | 45.5% |
| Mean | 33.8% | 34.2% |
| Median | 33.7% | 37.0% |
| Interquartile 25% (IQ1) | 29.1% | 26.6% |
| Interquartile 75% (IQ3) | 39.6% | 42.4% |
| Interquartile Range (IQR) | 10.6% | 15.7% |
| Standard Deviation (Sample) | 7.4% | 10.8% |
| Standard Deviation (Population) | 7.3% | 10.7% |
Similar Demographics by Associate's Degree
Demographics Similar to Cree by Associate's Degree
In terms of associate's degree, the demographic groups most similar to Cree are Immigrants from Grenada (42.6%, a difference of 0.18%), British West Indian (42.4%, a difference of 0.33%), Immigrants from West Indies (42.4%, a difference of 0.34%), Guyanese (42.3%, a difference of 0.45%), and Immigrants from Liberia (42.3%, a difference of 0.59%).
| Demographics | Rating | Rank | Associate's Degree |
| Tongans | 2.2 /100 | #233 | Tragic 43.0% |
| Tlingit-Haida | 2.1 /100 | #234 | Tragic 43.0% |
| Ecuadorians | 2.0 /100 | #235 | Tragic 43.0% |
| Immigrants | St. Vincent and the Grenadines | 1.9 /100 | #236 | Tragic 42.9% |
| Immigrants | Nonimmigrants | 1.9 /100 | #237 | Tragic 42.9% |
| Iroquois | 1.7 /100 | #238 | Tragic 42.8% |
| Immigrants | Grenada | 1.3 /100 | #239 | Tragic 42.6% |
| Cree | 1.2 /100 | #240 | Tragic 42.5% |
| British West Indians | 1.0 /100 | #241 | Tragic 42.4% |
| Immigrants | West Indies | 1.0 /100 | #242 | Tragic 42.4% |
| Guyanese | 1.0 /100 | #243 | Tragic 42.3% |
| Immigrants | Liberia | 0.9 /100 | #244 | Tragic 42.3% |
| Immigrants | Cambodia | 0.9 /100 | #245 | Tragic 42.3% |
| Delaware | 0.9 /100 | #246 | Tragic 42.3% |
| Immigrants | Fiji | 0.8 /100 | #247 | Tragic 42.2% |
Demographics Similar to Belizeans by Associate's Degree
In terms of associate's degree, the demographic groups most similar to Belizeans are Immigrants from Laos (40.7%, a difference of 0.070%), Chippewa (40.7%, a difference of 0.25%), Puget Sound Salish (40.5%, a difference of 0.29%), American (40.8%, a difference of 0.30%), and Immigrants from Dominica (40.5%, a difference of 0.43%).
| Demographics | Rating | Rank | Associate's Degree |
| Africans | 0.2 /100 | #265 | Tragic 41.1% |
| Samoans | 0.2 /100 | #266 | Tragic 41.1% |
| Hawaiians | 0.2 /100 | #267 | Tragic 40.9% |
| Central American Indians | 0.2 /100 | #268 | Tragic 40.8% |
| Americans | 0.2 /100 | #269 | Tragic 40.8% |
| Chippewa | 0.2 /100 | #270 | Tragic 40.7% |
| Immigrants | Laos | 0.1 /100 | #271 | Tragic 40.7% |
| Belizeans | 0.1 /100 | #272 | Tragic 40.6% |
| Puget Sound Salish | 0.1 /100 | #273 | Tragic 40.5% |
| Immigrants | Dominica | 0.1 /100 | #274 | Tragic 40.5% |
| Potawatomi | 0.1 /100 | #275 | Tragic 40.4% |
| Puerto Ricans | 0.1 /100 | #276 | Tragic 40.4% |
| Blackfeet | 0.1 /100 | #277 | Tragic 40.3% |
| Ottawa | 0.1 /100 | #278 | Tragic 40.3% |
| Immigrants | Nicaragua | 0.1 /100 | #279 | Tragic 40.3% |