Immigrants from Northern Europe vs Belizean Associate's Degree
COMPARE
Immigrants from Northern Europe
Belizean
Associate's Degree
Associate's Degree Comparison
Immigrants from Northern Europe
Belizeans
53.5%
ASSOCIATE'S DEGREE
100.0/ 100
METRIC RATING
31st/ 347
METRIC RANK
40.6%
ASSOCIATE'S DEGREE
0.1/ 100
METRIC RATING
272nd/ 347
METRIC RANK
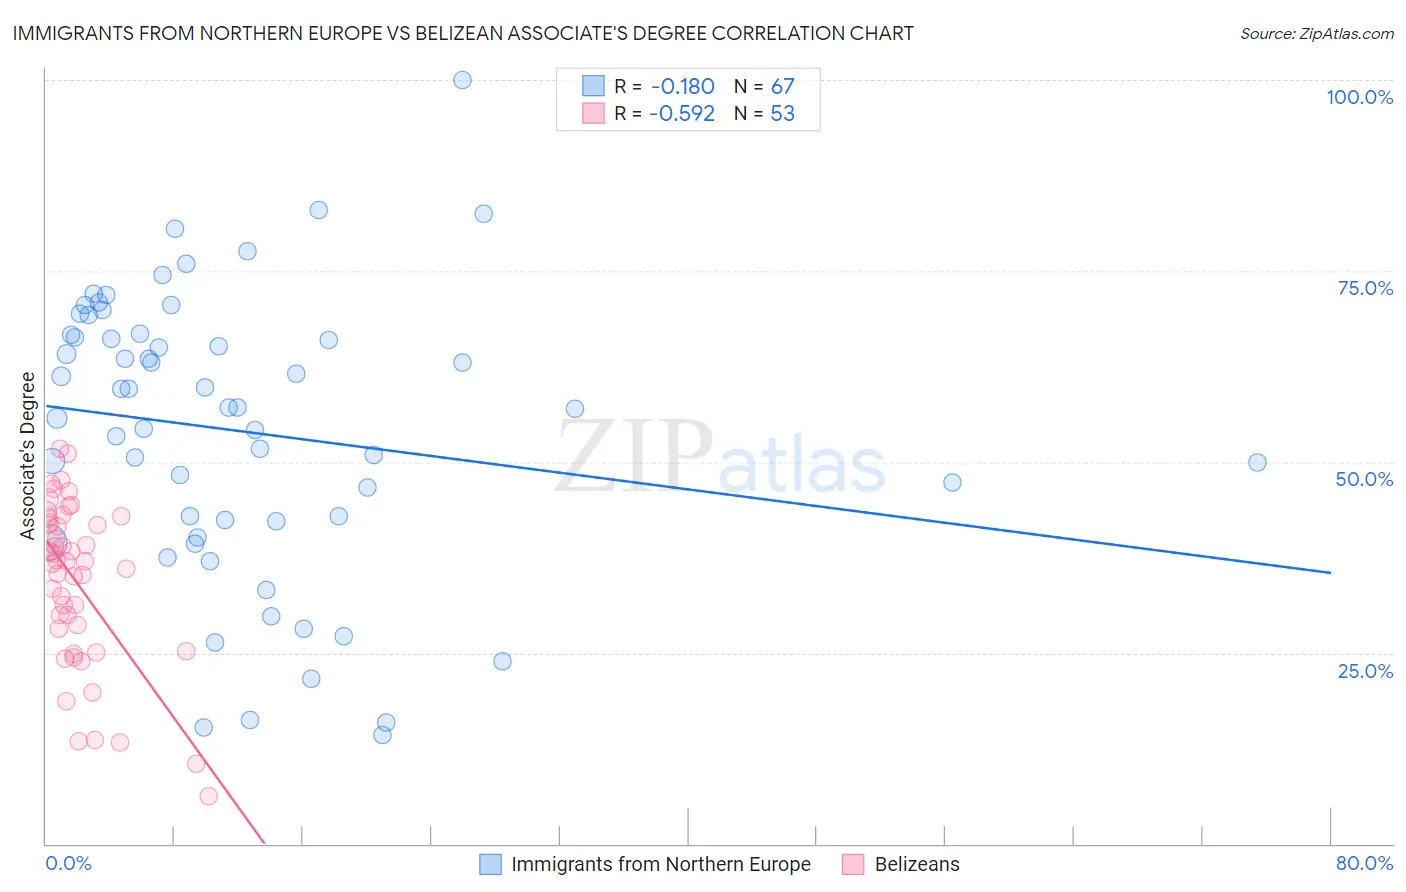
Immigrants from Northern Europe vs Belizean Associate's Degree Correlation Chart
The statistical analysis conducted on geographies consisting of 477,200,235 people shows a poor negative correlation between the proportion of Immigrants from Northern Europe and percentage of population with at least associate's degree education in the United States with a correlation coefficient (R) of -0.180 and weighted average of 53.5%. Similarly, the statistical analysis conducted on geographies consisting of 144,216,581 people shows a substantial negative correlation between the proportion of Belizeans and percentage of population with at least associate's degree education in the United States with a correlation coefficient (R) of -0.592 and weighted average of 40.6%, a difference of 31.6%.
Associate's Degree Correlation Summary
| Measurement | Immigrants from Northern Europe | Belizean |
| Minimum | 14.3% | 6.2% |
| Maximum | 100.0% | 51.7% |
| Range | 85.7% | 45.5% |
| Mean | 54.0% | 34.2% |
| Median | 57.1% | 37.0% |
| Interquartile 25% (IQ1) | 42.2% | 26.6% |
| Interquartile 75% (IQ3) | 66.6% | 42.4% |
| Interquartile Range (IQR) | 24.4% | 15.7% |
| Standard Deviation (Sample) | 18.6% | 10.8% |
| Standard Deviation (Population) | 18.4% | 10.7% |
Similar Demographics by Associate's Degree
Demographics Similar to Immigrants from Northern Europe by Associate's Degree
In terms of associate's degree, the demographic groups most similar to Immigrants from Northern Europe are Immigrants from Turkey (53.4%, a difference of 0.030%), Israeli (53.4%, a difference of 0.15%), Bulgarian (53.3%, a difference of 0.34%), Immigrants from Sri Lanka (53.7%, a difference of 0.36%), and Russian (53.2%, a difference of 0.40%).
| Demographics | Rating | Rank | Associate's Degree |
| Immigrants | Korea | 100.0 /100 | #24 | Exceptional 54.5% |
| Immigrants | Switzerland | 100.0 /100 | #25 | Exceptional 54.5% |
| Immigrants | Belgium | 100.0 /100 | #26 | Exceptional 54.5% |
| Latvians | 100.0 /100 | #27 | Exceptional 53.9% |
| Turks | 100.0 /100 | #28 | Exceptional 53.9% |
| Immigrants | France | 100.0 /100 | #29 | Exceptional 53.9% |
| Immigrants | Sri Lanka | 100.0 /100 | #30 | Exceptional 53.7% |
| Immigrants | Northern Europe | 100.0 /100 | #31 | Exceptional 53.5% |
| Immigrants | Turkey | 100.0 /100 | #32 | Exceptional 53.4% |
| Israelis | 100.0 /100 | #33 | Exceptional 53.4% |
| Bulgarians | 100.0 /100 | #34 | Exceptional 53.3% |
| Russians | 100.0 /100 | #35 | Exceptional 53.2% |
| Immigrants | Russia | 100.0 /100 | #36 | Exceptional 53.1% |
| Immigrants | Denmark | 100.0 /100 | #37 | Exceptional 53.1% |
| Mongolians | 100.0 /100 | #38 | Exceptional 53.0% |
Demographics Similar to Belizeans by Associate's Degree
In terms of associate's degree, the demographic groups most similar to Belizeans are Immigrants from Laos (40.7%, a difference of 0.070%), Chippewa (40.7%, a difference of 0.25%), Puget Sound Salish (40.5%, a difference of 0.29%), American (40.8%, a difference of 0.30%), and Immigrants from Dominica (40.5%, a difference of 0.43%).
| Demographics | Rating | Rank | Associate's Degree |
| Africans | 0.2 /100 | #265 | Tragic 41.1% |
| Samoans | 0.2 /100 | #266 | Tragic 41.1% |
| Hawaiians | 0.2 /100 | #267 | Tragic 40.9% |
| Central American Indians | 0.2 /100 | #268 | Tragic 40.8% |
| Americans | 0.2 /100 | #269 | Tragic 40.8% |
| Chippewa | 0.2 /100 | #270 | Tragic 40.7% |
| Immigrants | Laos | 0.1 /100 | #271 | Tragic 40.7% |
| Belizeans | 0.1 /100 | #272 | Tragic 40.6% |
| Puget Sound Salish | 0.1 /100 | #273 | Tragic 40.5% |
| Immigrants | Dominica | 0.1 /100 | #274 | Tragic 40.5% |
| Potawatomi | 0.1 /100 | #275 | Tragic 40.4% |
| Puerto Ricans | 0.1 /100 | #276 | Tragic 40.4% |
| Blackfeet | 0.1 /100 | #277 | Tragic 40.3% |
| Ottawa | 0.1 /100 | #278 | Tragic 40.3% |
| Immigrants | Nicaragua | 0.1 /100 | #279 | Tragic 40.3% |