Samoan vs Latvian Bachelor's Degree
COMPARE
Samoan
Latvian
Bachelor's Degree
Bachelor's Degree Comparison
Samoans
Latvians
31.8%
BACHELOR'S DEGREE
0.1/ 100
METRIC RATING
275th/ 347
METRIC RANK
46.1%
BACHELOR'S DEGREE
100.0/ 100
METRIC RATING
31st/ 347
METRIC RANK
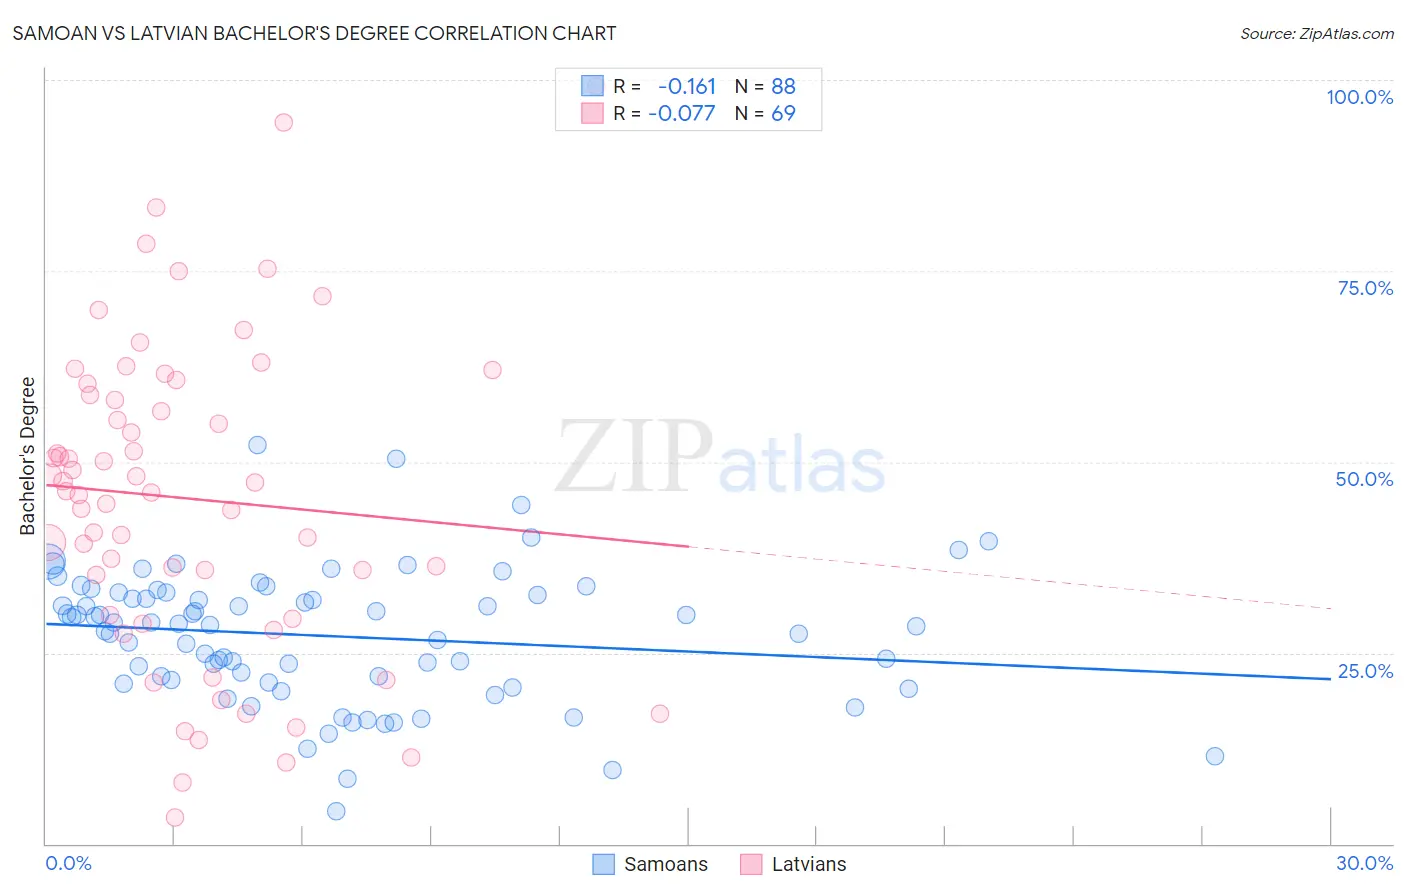
Samoan vs Latvian Bachelor's Degree Correlation Chart
The statistical analysis conducted on geographies consisting of 225,194,746 people shows a poor negative correlation between the proportion of Samoans and percentage of population with at least bachelor's degree education in the United States with a correlation coefficient (R) of -0.161 and weighted average of 31.8%. Similarly, the statistical analysis conducted on geographies consisting of 220,722,660 people shows a slight negative correlation between the proportion of Latvians and percentage of population with at least bachelor's degree education in the United States with a correlation coefficient (R) of -0.077 and weighted average of 46.1%, a difference of 44.9%.
Bachelor's Degree Correlation Summary
| Measurement | Samoan | Latvian |
| Minimum | 4.2% | 3.4% |
| Maximum | 52.2% | 99.2% |
| Range | 48.0% | 95.8% |
| Mean | 27.2% | 45.2% |
| Median | 28.7% | 46.1% |
| Interquartile 25% (IQ1) | 21.2% | 29.7% |
| Interquartile 75% (IQ3) | 32.7% | 59.5% |
| Interquartile Range (IQR) | 11.5% | 29.8% |
| Standard Deviation (Sample) | 8.7% | 20.7% |
| Standard Deviation (Population) | 8.6% | 20.5% |
Similar Demographics by Bachelor's Degree
Demographics Similar to Samoans by Bachelor's Degree
In terms of bachelor's degree, the demographic groups most similar to Samoans are Salvadoran (31.8%, a difference of 0.040%), Potawatomi (31.9%, a difference of 0.13%), American (31.9%, a difference of 0.15%), Dominican (31.8%, a difference of 0.19%), and Marshallese (31.7%, a difference of 0.24%).
| Demographics | Rating | Rank | Bachelor's Degree |
| Immigrants | Portugal | 0.2 /100 | #268 | Tragic 32.2% |
| Immigrants | Belize | 0.2 /100 | #269 | Tragic 32.1% |
| Immigrants | Nicaragua | 0.2 /100 | #270 | Tragic 31.9% |
| Central Americans | 0.2 /100 | #271 | Tragic 31.9% |
| Comanche | 0.2 /100 | #272 | Tragic 31.9% |
| Americans | 0.2 /100 | #273 | Tragic 31.9% |
| Potawatomi | 0.2 /100 | #274 | Tragic 31.9% |
| Samoans | 0.1 /100 | #275 | Tragic 31.8% |
| Salvadorans | 0.1 /100 | #276 | Tragic 31.8% |
| Dominicans | 0.1 /100 | #277 | Tragic 31.8% |
| Marshallese | 0.1 /100 | #278 | Tragic 31.7% |
| Hawaiians | 0.1 /100 | #279 | Tragic 31.6% |
| Immigrants | Laos | 0.1 /100 | #280 | Tragic 31.6% |
| Blackfeet | 0.1 /100 | #281 | Tragic 31.5% |
| Immigrants | Caribbean | 0.1 /100 | #282 | Tragic 31.4% |
Demographics Similar to Latvians by Bachelor's Degree
In terms of bachelor's degree, the demographic groups most similar to Latvians are Immigrants from Sri Lanka (46.1%, a difference of 0.040%), Israeli (46.1%, a difference of 0.090%), Turkish (46.2%, a difference of 0.22%), Immigrants from Turkey (46.0%, a difference of 0.30%), and Immigrants from France (46.4%, a difference of 0.68%).
| Demographics | Rating | Rank | Bachelor's Degree |
| Immigrants | Korea | 100.0 /100 | #24 | Exceptional 47.0% |
| Burmese | 100.0 /100 | #25 | Exceptional 46.9% |
| Immigrants | Japan | 100.0 /100 | #26 | Exceptional 46.8% |
| Immigrants | France | 100.0 /100 | #27 | Exceptional 46.4% |
| Turks | 100.0 /100 | #28 | Exceptional 46.2% |
| Israelis | 100.0 /100 | #29 | Exceptional 46.1% |
| Immigrants | Sri Lanka | 100.0 /100 | #30 | Exceptional 46.1% |
| Latvians | 100.0 /100 | #31 | Exceptional 46.1% |
| Immigrants | Turkey | 100.0 /100 | #32 | Exceptional 46.0% |
| Immigrants | Northern Europe | 100.0 /100 | #33 | Exceptional 45.6% |
| Immigrants | Denmark | 100.0 /100 | #34 | Exceptional 45.4% |
| Immigrants | Russia | 100.0 /100 | #35 | Exceptional 45.4% |
| Mongolians | 100.0 /100 | #36 | Exceptional 45.4% |
| Russians | 100.0 /100 | #37 | Exceptional 45.3% |
| Bulgarians | 100.0 /100 | #38 | Exceptional 45.3% |