Samoan vs Honduran Bachelor's Degree
COMPARE
Samoan
Honduran
Bachelor's Degree
Bachelor's Degree Comparison
Samoans
Hondurans
31.8%
BACHELOR'S DEGREE
0.1/ 100
METRIC RATING
275th/ 347
METRIC RANK
31.3%
BACHELOR'S DEGREE
0.1/ 100
METRIC RATING
283rd/ 347
METRIC RANK
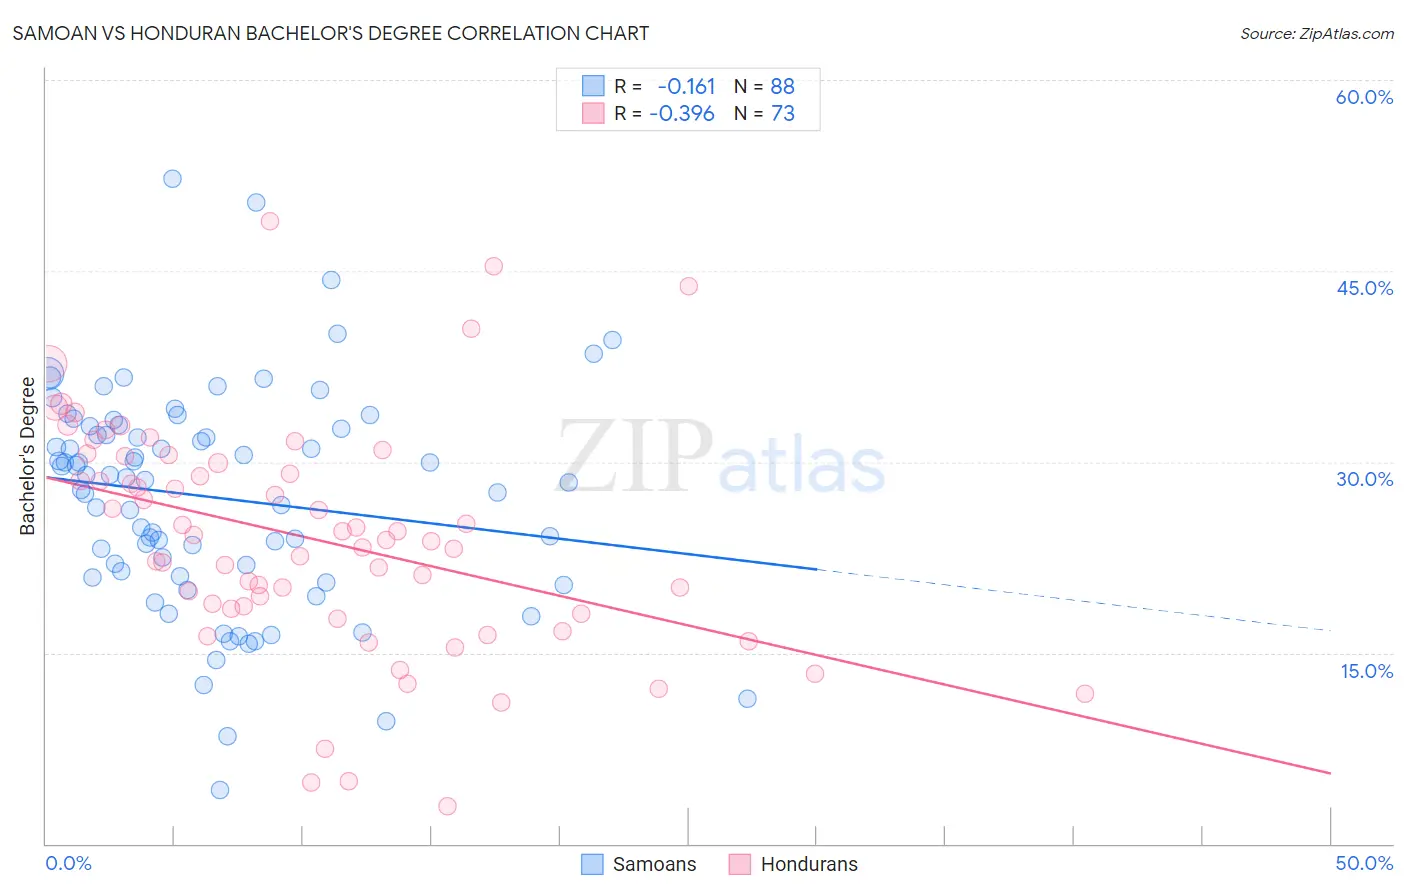
Samoan vs Honduran Bachelor's Degree Correlation Chart
The statistical analysis conducted on geographies consisting of 225,194,746 people shows a poor negative correlation between the proportion of Samoans and percentage of population with at least bachelor's degree education in the United States with a correlation coefficient (R) of -0.161 and weighted average of 31.8%. Similarly, the statistical analysis conducted on geographies consisting of 357,779,411 people shows a mild negative correlation between the proportion of Hondurans and percentage of population with at least bachelor's degree education in the United States with a correlation coefficient (R) of -0.396 and weighted average of 31.3%, a difference of 1.5%.
Bachelor's Degree Correlation Summary
| Measurement | Samoan | Honduran |
| Minimum | 4.2% | 3.0% |
| Maximum | 52.2% | 48.9% |
| Range | 48.0% | 45.9% |
| Mean | 27.2% | 24.0% |
| Median | 28.7% | 23.9% |
| Interquartile 25% (IQ1) | 21.2% | 18.3% |
| Interquartile 75% (IQ3) | 32.7% | 30.2% |
| Interquartile Range (IQR) | 11.5% | 11.9% |
| Standard Deviation (Sample) | 8.7% | 9.1% |
| Standard Deviation (Population) | 8.6% | 9.0% |
Demographics Similar to Samoans and Hondurans by Bachelor's Degree
In terms of bachelor's degree, the demographic groups most similar to Samoans are Salvadoran (31.8%, a difference of 0.040%), Potawatomi (31.9%, a difference of 0.13%), American (31.9%, a difference of 0.15%), Dominican (31.8%, a difference of 0.19%), and Marshallese (31.7%, a difference of 0.24%). Similarly, the demographic groups most similar to Hondurans are Haitian (31.3%, a difference of 0.030%), Aleut (31.3%, a difference of 0.040%), Immigrants from El Salvador (31.3%, a difference of 0.10%), Immigrants from Caribbean (31.4%, a difference of 0.28%), and Blackfeet (31.5%, a difference of 0.42%).
| Demographics | Rating | Rank | Bachelor's Degree |
| Immigrants | Belize | 0.2 /100 | #269 | Tragic 32.1% |
| Immigrants | Nicaragua | 0.2 /100 | #270 | Tragic 31.9% |
| Central Americans | 0.2 /100 | #271 | Tragic 31.9% |
| Comanche | 0.2 /100 | #272 | Tragic 31.9% |
| Americans | 0.2 /100 | #273 | Tragic 31.9% |
| Potawatomi | 0.2 /100 | #274 | Tragic 31.9% |
| Samoans | 0.1 /100 | #275 | Tragic 31.8% |
| Salvadorans | 0.1 /100 | #276 | Tragic 31.8% |
| Dominicans | 0.1 /100 | #277 | Tragic 31.8% |
| Marshallese | 0.1 /100 | #278 | Tragic 31.7% |
| Hawaiians | 0.1 /100 | #279 | Tragic 31.6% |
| Immigrants | Laos | 0.1 /100 | #280 | Tragic 31.6% |
| Blackfeet | 0.1 /100 | #281 | Tragic 31.5% |
| Immigrants | Caribbean | 0.1 /100 | #282 | Tragic 31.4% |
| Hondurans | 0.1 /100 | #283 | Tragic 31.3% |
| Haitians | 0.1 /100 | #284 | Tragic 31.3% |
| Aleuts | 0.1 /100 | #285 | Tragic 31.3% |
| Immigrants | El Salvador | 0.1 /100 | #286 | Tragic 31.3% |
| Ottawa | 0.1 /100 | #287 | Tragic 31.1% |
| Guatemalans | 0.1 /100 | #288 | Tragic 31.0% |
| Puerto Ricans | 0.1 /100 | #289 | Tragic 31.0% |