Samoan vs Immigrants from Congo Bachelor's Degree
COMPARE
Samoan
Immigrants from Congo
Bachelor's Degree
Bachelor's Degree Comparison
Samoans
Immigrants from Congo
31.8%
BACHELOR'S DEGREE
0.1/ 100
METRIC RATING
275th/ 347
METRIC RANK
33.6%
BACHELOR'S DEGREE
1.0/ 100
METRIC RATING
247th/ 347
METRIC RANK
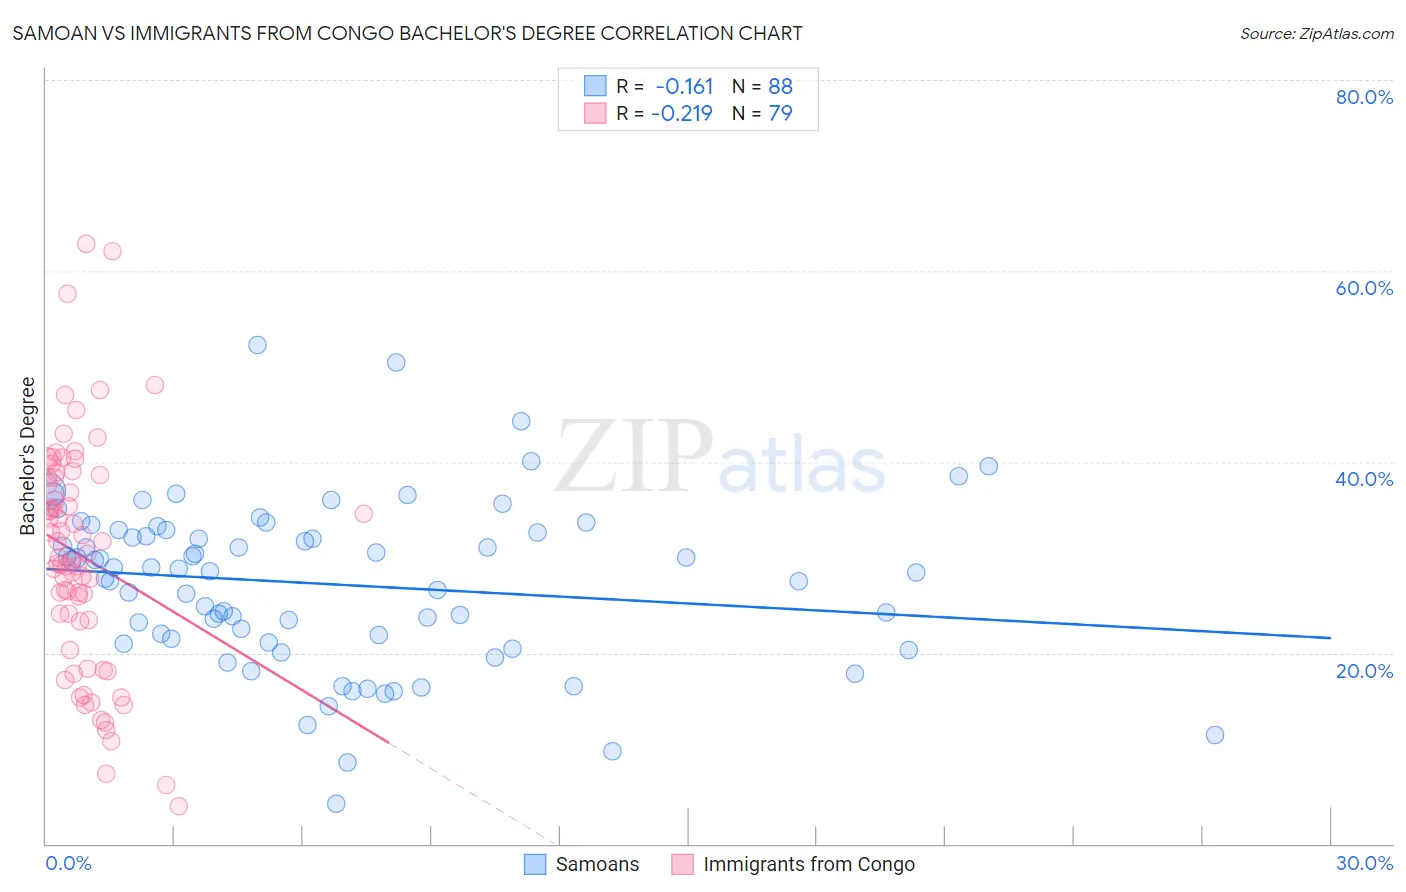
Samoan vs Immigrants from Congo Bachelor's Degree Correlation Chart
The statistical analysis conducted on geographies consisting of 225,194,746 people shows a poor negative correlation between the proportion of Samoans and percentage of population with at least bachelor's degree education in the United States with a correlation coefficient (R) of -0.161 and weighted average of 31.8%. Similarly, the statistical analysis conducted on geographies consisting of 92,128,050 people shows a weak negative correlation between the proportion of Immigrants from Congo and percentage of population with at least bachelor's degree education in the United States with a correlation coefficient (R) of -0.219 and weighted average of 33.6%, a difference of 5.6%.
Bachelor's Degree Correlation Summary
| Measurement | Samoan | Immigrants from Congo |
| Minimum | 4.2% | 3.9% |
| Maximum | 52.2% | 62.9% |
| Range | 48.0% | 59.0% |
| Mean | 27.2% | 30.2% |
| Median | 28.7% | 30.0% |
| Interquartile 25% (IQ1) | 21.2% | 23.3% |
| Interquartile 75% (IQ3) | 32.7% | 38.4% |
| Interquartile Range (IQR) | 11.5% | 15.1% |
| Standard Deviation (Sample) | 8.7% | 12.1% |
| Standard Deviation (Population) | 8.6% | 12.0% |
Similar Demographics by Bachelor's Degree
Demographics Similar to Samoans by Bachelor's Degree
In terms of bachelor's degree, the demographic groups most similar to Samoans are Salvadoran (31.8%, a difference of 0.040%), Potawatomi (31.9%, a difference of 0.13%), American (31.9%, a difference of 0.15%), Dominican (31.8%, a difference of 0.19%), and Marshallese (31.7%, a difference of 0.24%).
| Demographics | Rating | Rank | Bachelor's Degree |
| Immigrants | Portugal | 0.2 /100 | #268 | Tragic 32.2% |
| Immigrants | Belize | 0.2 /100 | #269 | Tragic 32.1% |
| Immigrants | Nicaragua | 0.2 /100 | #270 | Tragic 31.9% |
| Central Americans | 0.2 /100 | #271 | Tragic 31.9% |
| Comanche | 0.2 /100 | #272 | Tragic 31.9% |
| Americans | 0.2 /100 | #273 | Tragic 31.9% |
| Potawatomi | 0.2 /100 | #274 | Tragic 31.9% |
| Samoans | 0.1 /100 | #275 | Tragic 31.8% |
| Salvadorans | 0.1 /100 | #276 | Tragic 31.8% |
| Dominicans | 0.1 /100 | #277 | Tragic 31.8% |
| Marshallese | 0.1 /100 | #278 | Tragic 31.7% |
| Hawaiians | 0.1 /100 | #279 | Tragic 31.6% |
| Immigrants | Laos | 0.1 /100 | #280 | Tragic 31.6% |
| Blackfeet | 0.1 /100 | #281 | Tragic 31.5% |
| Immigrants | Caribbean | 0.1 /100 | #282 | Tragic 31.4% |
Demographics Similar to Immigrants from Congo by Bachelor's Degree
In terms of bachelor's degree, the demographic groups most similar to Immigrants from Congo are Cree (33.6%, a difference of 0.010%), Jamaican (33.6%, a difference of 0.090%), Immigrants from Liberia (33.5%, a difference of 0.14%), Indonesian (33.5%, a difference of 0.15%), and Immigrants from Fiji (33.7%, a difference of 0.45%).
| Demographics | Rating | Rank | Bachelor's Degree |
| Tongans | 2.0 /100 | #240 | Tragic 34.3% |
| Immigrants | Cambodia | 1.9 /100 | #241 | Tragic 34.2% |
| Immigrants | Nonimmigrants | 1.8 /100 | #242 | Tragic 34.2% |
| Immigrants | Guyana | 1.4 /100 | #243 | Tragic 33.9% |
| Delaware | 1.2 /100 | #244 | Tragic 33.8% |
| Immigrants | Fiji | 1.2 /100 | #245 | Tragic 33.7% |
| Jamaicans | 1.0 /100 | #246 | Tragic 33.6% |
| Immigrants | Congo | 1.0 /100 | #247 | Tragic 33.6% |
| Cree | 1.0 /100 | #248 | Tragic 33.6% |
| Immigrants | Liberia | 0.9 /100 | #249 | Tragic 33.5% |
| Indonesians | 0.9 /100 | #250 | Tragic 33.5% |
| Japanese | 0.7 /100 | #251 | Tragic 33.3% |
| Immigrants | Bahamas | 0.7 /100 | #252 | Tragic 33.3% |
| U.S. Virgin Islanders | 0.7 /100 | #253 | Tragic 33.2% |
| Native Hawaiians | 0.7 /100 | #254 | Tragic 33.2% |