Samoan vs Sri Lankan Bachelor's Degree
COMPARE
Samoan
Sri Lankan
Bachelor's Degree
Bachelor's Degree Comparison
Samoans
Sri Lankans
31.8%
BACHELOR'S DEGREE
0.1/ 100
METRIC RATING
275th/ 347
METRIC RANK
38.2%
BACHELOR'S DEGREE
59.1/ 100
METRIC RATING
165th/ 347
METRIC RANK
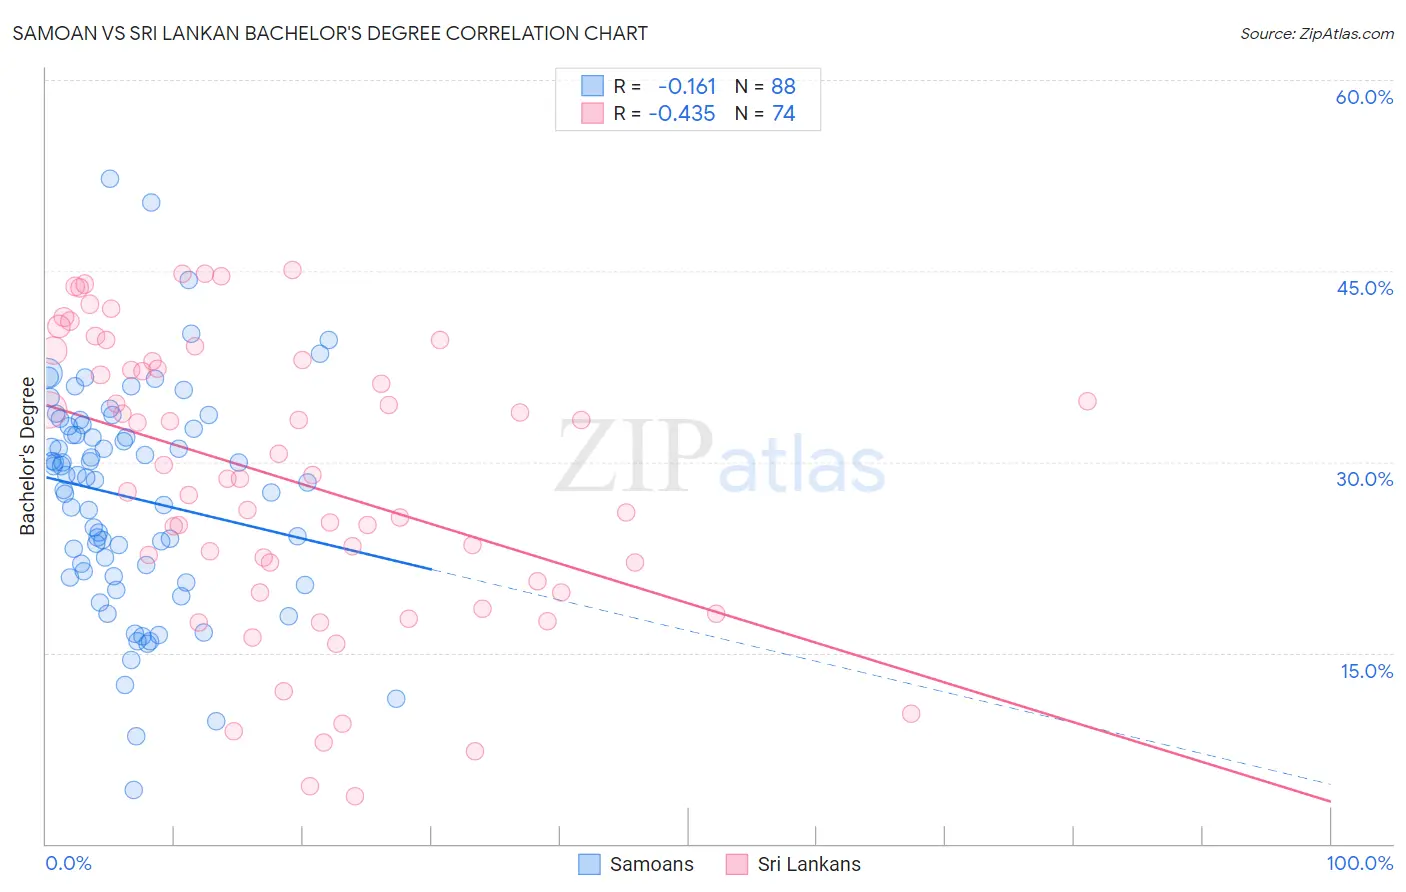
Samoan vs Sri Lankan Bachelor's Degree Correlation Chart
The statistical analysis conducted on geographies consisting of 225,194,746 people shows a poor negative correlation between the proportion of Samoans and percentage of population with at least bachelor's degree education in the United States with a correlation coefficient (R) of -0.161 and weighted average of 31.8%. Similarly, the statistical analysis conducted on geographies consisting of 440,520,330 people shows a moderate negative correlation between the proportion of Sri Lankans and percentage of population with at least bachelor's degree education in the United States with a correlation coefficient (R) of -0.435 and weighted average of 38.2%, a difference of 20.0%.
Bachelor's Degree Correlation Summary
| Measurement | Samoan | Sri Lankan |
| Minimum | 4.2% | 3.7% |
| Maximum | 52.2% | 45.1% |
| Range | 48.0% | 41.4% |
| Mean | 27.2% | 28.6% |
| Median | 28.7% | 28.8% |
| Interquartile 25% (IQ1) | 21.2% | 20.6% |
| Interquartile 75% (IQ3) | 32.7% | 37.9% |
| Interquartile Range (IQR) | 11.5% | 17.3% |
| Standard Deviation (Sample) | 8.7% | 11.1% |
| Standard Deviation (Population) | 8.6% | 11.0% |
Similar Demographics by Bachelor's Degree
Demographics Similar to Samoans by Bachelor's Degree
In terms of bachelor's degree, the demographic groups most similar to Samoans are Salvadoran (31.8%, a difference of 0.040%), Potawatomi (31.9%, a difference of 0.13%), American (31.9%, a difference of 0.15%), Dominican (31.8%, a difference of 0.19%), and Marshallese (31.7%, a difference of 0.24%).
| Demographics | Rating | Rank | Bachelor's Degree |
| Immigrants | Portugal | 0.2 /100 | #268 | Tragic 32.2% |
| Immigrants | Belize | 0.2 /100 | #269 | Tragic 32.1% |
| Immigrants | Nicaragua | 0.2 /100 | #270 | Tragic 31.9% |
| Central Americans | 0.2 /100 | #271 | Tragic 31.9% |
| Comanche | 0.2 /100 | #272 | Tragic 31.9% |
| Americans | 0.2 /100 | #273 | Tragic 31.9% |
| Potawatomi | 0.2 /100 | #274 | Tragic 31.9% |
| Samoans | 0.1 /100 | #275 | Tragic 31.8% |
| Salvadorans | 0.1 /100 | #276 | Tragic 31.8% |
| Dominicans | 0.1 /100 | #277 | Tragic 31.8% |
| Marshallese | 0.1 /100 | #278 | Tragic 31.7% |
| Hawaiians | 0.1 /100 | #279 | Tragic 31.6% |
| Immigrants | Laos | 0.1 /100 | #280 | Tragic 31.6% |
| Blackfeet | 0.1 /100 | #281 | Tragic 31.5% |
| Immigrants | Caribbean | 0.1 /100 | #282 | Tragic 31.4% |
Demographics Similar to Sri Lankans by Bachelor's Degree
In terms of bachelor's degree, the demographic groups most similar to Sri Lankans are Somali (38.1%, a difference of 0.050%), Scottish (38.1%, a difference of 0.25%), Danish (38.1%, a difference of 0.29%), Hungarian (38.3%, a difference of 0.30%), and Ghanaian (38.0%, a difference of 0.37%).
| Demographics | Rating | Rank | Bachelor's Degree |
| Immigrants | Germany | 69.6 /100 | #158 | Good 38.6% |
| Chinese | 66.6 /100 | #159 | Good 38.5% |
| Vietnamese | 66.6 /100 | #160 | Good 38.5% |
| Uruguayans | 65.8 /100 | #161 | Good 38.4% |
| Colombians | 65.0 /100 | #162 | Good 38.4% |
| Peruvians | 63.4 /100 | #163 | Good 38.3% |
| Hungarians | 62.1 /100 | #164 | Good 38.3% |
| Sri Lankans | 59.1 /100 | #165 | Average 38.2% |
| Somalis | 58.6 /100 | #166 | Average 38.1% |
| Scottish | 56.6 /100 | #167 | Average 38.1% |
| Danes | 56.2 /100 | #168 | Average 38.1% |
| Ghanaians | 55.3 /100 | #169 | Average 38.0% |
| Czechs | 54.4 /100 | #170 | Average 38.0% |
| Bermudans | 54.2 /100 | #171 | Average 38.0% |
| Immigrants | Somalia | 52.8 /100 | #172 | Average 37.9% |