Vietnamese vs Latvian Bachelor's Degree
COMPARE
Vietnamese
Latvian
Bachelor's Degree
Bachelor's Degree Comparison
Vietnamese
Latvians
38.5%
BACHELOR'S DEGREE
66.6/ 100
METRIC RATING
160th/ 347
METRIC RANK
46.1%
BACHELOR'S DEGREE
100.0/ 100
METRIC RATING
31st/ 347
METRIC RANK
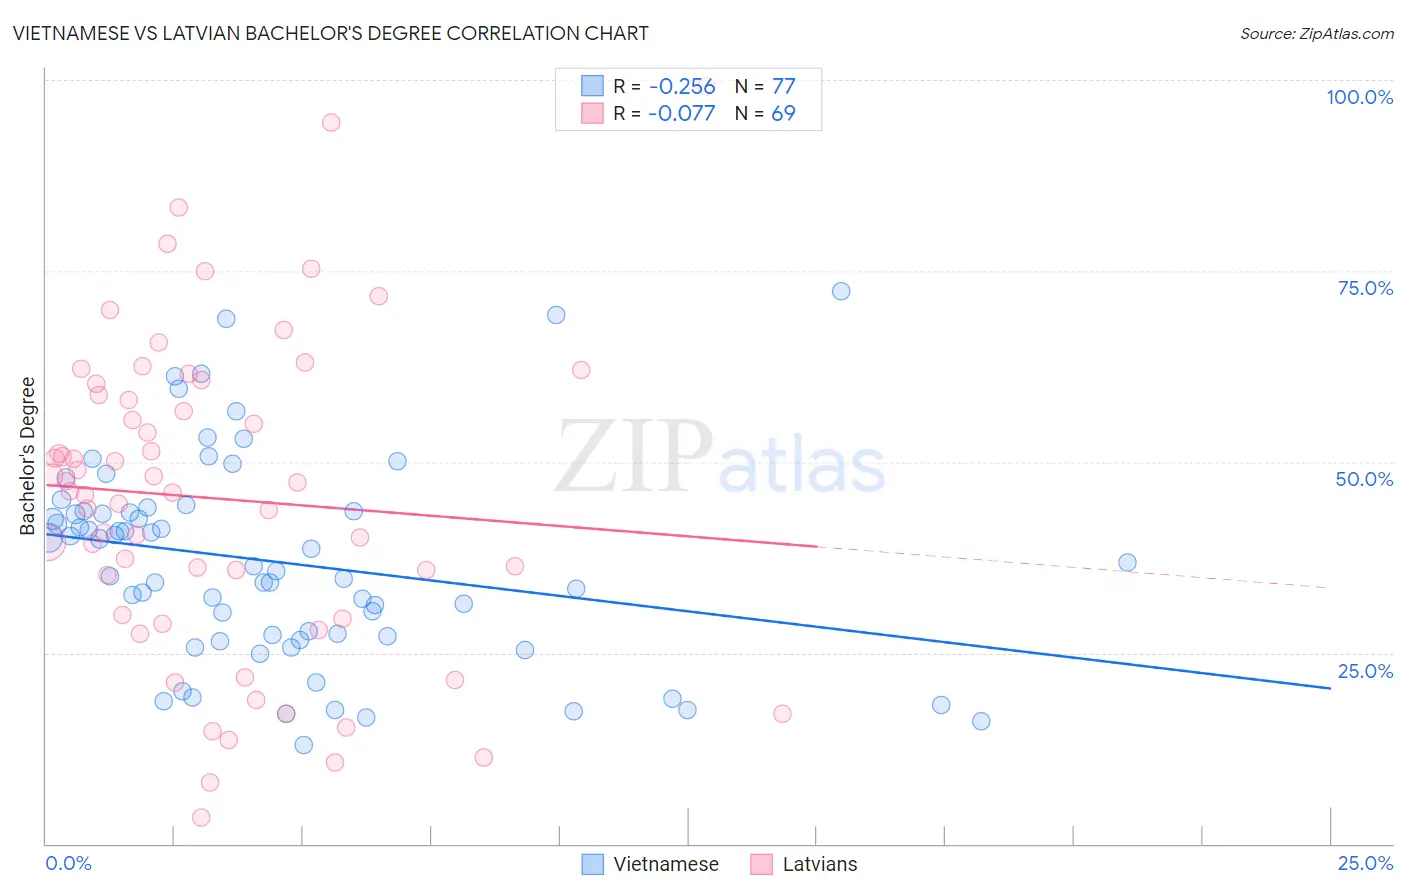
Vietnamese vs Latvian Bachelor's Degree Correlation Chart
The statistical analysis conducted on geographies consisting of 170,741,328 people shows a weak negative correlation between the proportion of Vietnamese and percentage of population with at least bachelor's degree education in the United States with a correlation coefficient (R) of -0.256 and weighted average of 38.5%. Similarly, the statistical analysis conducted on geographies consisting of 220,722,660 people shows a slight negative correlation between the proportion of Latvians and percentage of population with at least bachelor's degree education in the United States with a correlation coefficient (R) of -0.077 and weighted average of 46.1%, a difference of 19.8%.
Bachelor's Degree Correlation Summary
| Measurement | Vietnamese | Latvian |
| Minimum | 13.0% | 3.4% |
| Maximum | 72.4% | 99.2% |
| Range | 59.4% | 95.8% |
| Mean | 36.9% | 45.2% |
| Median | 36.3% | 46.1% |
| Interquartile 25% (IQ1) | 27.0% | 29.7% |
| Interquartile 75% (IQ3) | 43.6% | 59.5% |
| Interquartile Range (IQR) | 16.6% | 29.8% |
| Standard Deviation (Sample) | 13.4% | 20.7% |
| Standard Deviation (Population) | 13.3% | 20.5% |
Similar Demographics by Bachelor's Degree
Demographics Similar to Vietnamese by Bachelor's Degree
In terms of bachelor's degree, the demographic groups most similar to Vietnamese are Chinese (38.5%, a difference of 0.0%), Uruguayan (38.4%, a difference of 0.080%), Colombian (38.4%, a difference of 0.16%), Immigrants from Germany (38.6%, a difference of 0.33%), and Peruvian (38.3%, a difference of 0.33%).
| Demographics | Rating | Rank | Bachelor's Degree |
| Slavs | 75.9 /100 | #153 | Good 38.9% |
| Canadians | 75.0 /100 | #154 | Good 38.8% |
| Immigrants | Kenya | 73.8 /100 | #155 | Good 38.8% |
| Kenyans | 72.5 /100 | #156 | Good 38.7% |
| Immigrants | South America | 70.1 /100 | #157 | Good 38.6% |
| Immigrants | Germany | 69.6 /100 | #158 | Good 38.6% |
| Chinese | 66.6 /100 | #159 | Good 38.5% |
| Vietnamese | 66.6 /100 | #160 | Good 38.5% |
| Uruguayans | 65.8 /100 | #161 | Good 38.4% |
| Colombians | 65.0 /100 | #162 | Good 38.4% |
| Peruvians | 63.4 /100 | #163 | Good 38.3% |
| Hungarians | 62.1 /100 | #164 | Good 38.3% |
| Sri Lankans | 59.1 /100 | #165 | Average 38.2% |
| Somalis | 58.6 /100 | #166 | Average 38.1% |
| Scottish | 56.6 /100 | #167 | Average 38.1% |
Demographics Similar to Latvians by Bachelor's Degree
In terms of bachelor's degree, the demographic groups most similar to Latvians are Immigrants from Sri Lanka (46.1%, a difference of 0.040%), Israeli (46.1%, a difference of 0.090%), Turkish (46.2%, a difference of 0.22%), Immigrants from Turkey (46.0%, a difference of 0.30%), and Immigrants from France (46.4%, a difference of 0.68%).
| Demographics | Rating | Rank | Bachelor's Degree |
| Immigrants | Korea | 100.0 /100 | #24 | Exceptional 47.0% |
| Burmese | 100.0 /100 | #25 | Exceptional 46.9% |
| Immigrants | Japan | 100.0 /100 | #26 | Exceptional 46.8% |
| Immigrants | France | 100.0 /100 | #27 | Exceptional 46.4% |
| Turks | 100.0 /100 | #28 | Exceptional 46.2% |
| Israelis | 100.0 /100 | #29 | Exceptional 46.1% |
| Immigrants | Sri Lanka | 100.0 /100 | #30 | Exceptional 46.1% |
| Latvians | 100.0 /100 | #31 | Exceptional 46.1% |
| Immigrants | Turkey | 100.0 /100 | #32 | Exceptional 46.0% |
| Immigrants | Northern Europe | 100.0 /100 | #33 | Exceptional 45.6% |
| Immigrants | Denmark | 100.0 /100 | #34 | Exceptional 45.4% |
| Immigrants | Russia | 100.0 /100 | #35 | Exceptional 45.4% |
| Mongolians | 100.0 /100 | #36 | Exceptional 45.4% |
| Russians | 100.0 /100 | #37 | Exceptional 45.3% |
| Bulgarians | 100.0 /100 | #38 | Exceptional 45.3% |