Samoan vs Colville Bachelor's Degree
COMPARE
Samoan
Colville
Bachelor's Degree
Bachelor's Degree Comparison
Samoans
Colville
31.8%
BACHELOR'S DEGREE
0.1/ 100
METRIC RATING
275th/ 347
METRIC RANK
29.0%
BACHELOR'S DEGREE
0.0/ 100
METRIC RATING
317th/ 347
METRIC RANK
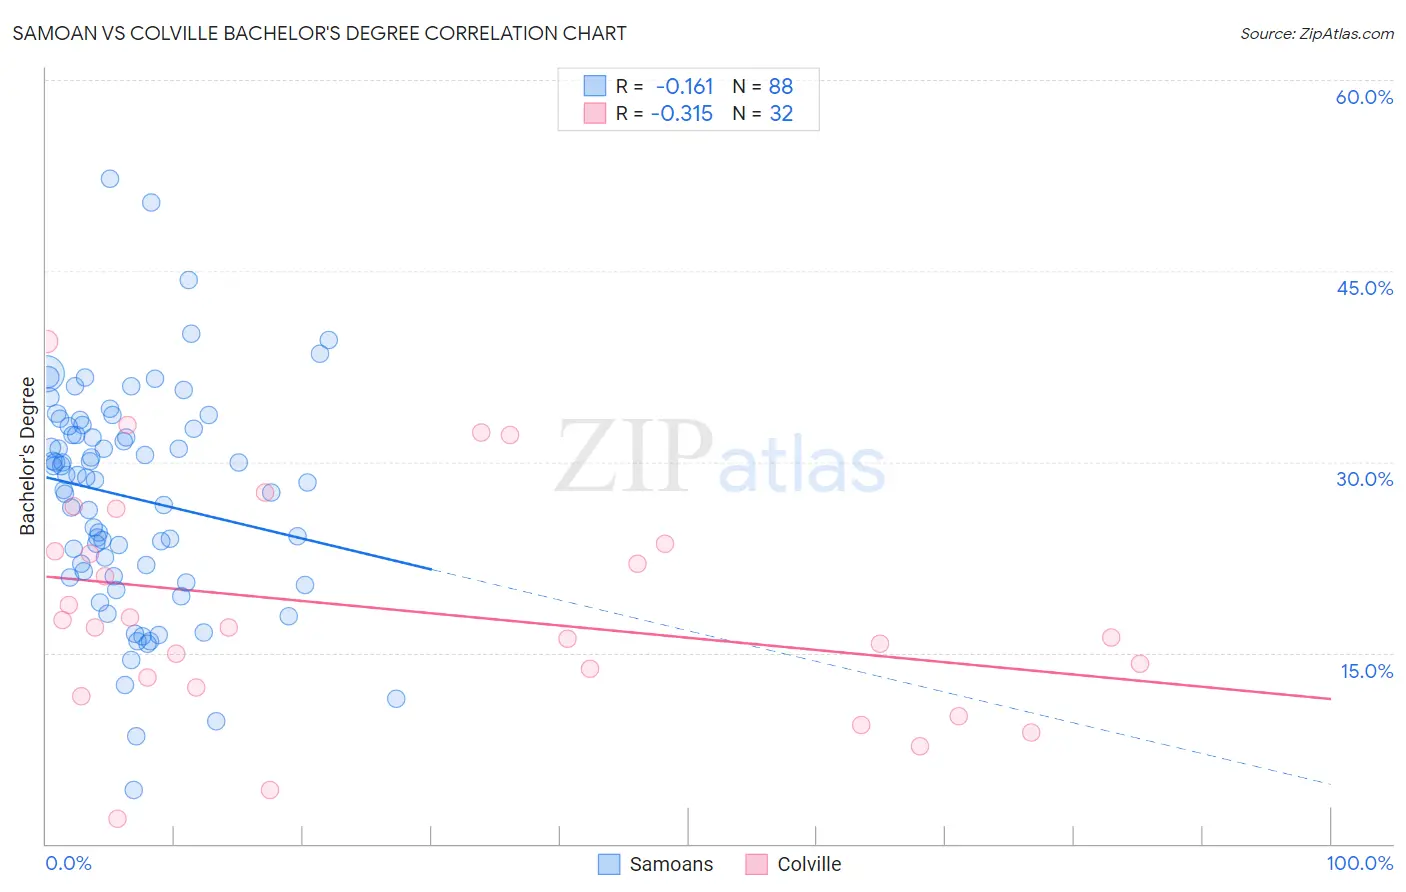
Samoan vs Colville Bachelor's Degree Correlation Chart
The statistical analysis conducted on geographies consisting of 225,194,746 people shows a poor negative correlation between the proportion of Samoans and percentage of population with at least bachelor's degree education in the United States with a correlation coefficient (R) of -0.161 and weighted average of 31.8%. Similarly, the statistical analysis conducted on geographies consisting of 34,683,925 people shows a mild negative correlation between the proportion of Colville and percentage of population with at least bachelor's degree education in the United States with a correlation coefficient (R) of -0.315 and weighted average of 29.0%, a difference of 9.7%.
Bachelor's Degree Correlation Summary
| Measurement | Samoan | Colville |
| Minimum | 4.2% | 1.9% |
| Maximum | 52.2% | 39.5% |
| Range | 48.0% | 37.5% |
| Mean | 27.2% | 18.3% |
| Median | 28.7% | 17.0% |
| Interquartile 25% (IQ1) | 21.2% | 12.7% |
| Interquartile 75% (IQ3) | 32.7% | 23.2% |
| Interquartile Range (IQR) | 11.5% | 10.6% |
| Standard Deviation (Sample) | 8.7% | 8.7% |
| Standard Deviation (Population) | 8.6% | 8.6% |
Similar Demographics by Bachelor's Degree
Demographics Similar to Samoans by Bachelor's Degree
In terms of bachelor's degree, the demographic groups most similar to Samoans are Salvadoran (31.8%, a difference of 0.040%), Potawatomi (31.9%, a difference of 0.13%), American (31.9%, a difference of 0.15%), Dominican (31.8%, a difference of 0.19%), and Marshallese (31.7%, a difference of 0.24%).
| Demographics | Rating | Rank | Bachelor's Degree |
| Immigrants | Portugal | 0.2 /100 | #268 | Tragic 32.2% |
| Immigrants | Belize | 0.2 /100 | #269 | Tragic 32.1% |
| Immigrants | Nicaragua | 0.2 /100 | #270 | Tragic 31.9% |
| Central Americans | 0.2 /100 | #271 | Tragic 31.9% |
| Comanche | 0.2 /100 | #272 | Tragic 31.9% |
| Americans | 0.2 /100 | #273 | Tragic 31.9% |
| Potawatomi | 0.2 /100 | #274 | Tragic 31.9% |
| Samoans | 0.1 /100 | #275 | Tragic 31.8% |
| Salvadorans | 0.1 /100 | #276 | Tragic 31.8% |
| Dominicans | 0.1 /100 | #277 | Tragic 31.8% |
| Marshallese | 0.1 /100 | #278 | Tragic 31.7% |
| Hawaiians | 0.1 /100 | #279 | Tragic 31.6% |
| Immigrants | Laos | 0.1 /100 | #280 | Tragic 31.6% |
| Blackfeet | 0.1 /100 | #281 | Tragic 31.5% |
| Immigrants | Caribbean | 0.1 /100 | #282 | Tragic 31.4% |
Demographics Similar to Colville by Bachelor's Degree
In terms of bachelor's degree, the demographic groups most similar to Colville are Yaqui (29.0%, a difference of 0.050%), Sioux (29.1%, a difference of 0.20%), Creek (28.9%, a difference of 0.50%), Kiowa (28.8%, a difference of 0.55%), and Alaskan Athabascan (28.8%, a difference of 0.63%).
| Demographics | Rating | Rank | Bachelor's Degree |
| Cheyenne | 0.0 /100 | #310 | Tragic 29.4% |
| Choctaw | 0.0 /100 | #311 | Tragic 29.4% |
| Seminole | 0.0 /100 | #312 | Tragic 29.4% |
| Alaska Natives | 0.0 /100 | #313 | Tragic 29.4% |
| Shoshone | 0.0 /100 | #314 | Tragic 29.3% |
| Immigrants | Cabo Verde | 0.0 /100 | #315 | Tragic 29.2% |
| Sioux | 0.0 /100 | #316 | Tragic 29.1% |
| Colville | 0.0 /100 | #317 | Tragic 29.0% |
| Yaqui | 0.0 /100 | #318 | Tragic 29.0% |
| Creek | 0.0 /100 | #319 | Tragic 28.9% |
| Kiowa | 0.0 /100 | #320 | Tragic 28.8% |
| Alaskan Athabascans | 0.0 /100 | #321 | Tragic 28.8% |
| Tsimshian | 0.0 /100 | #322 | Tragic 28.8% |
| Fijians | 0.0 /100 | #323 | Tragic 28.7% |
| Dutch West Indians | 0.0 /100 | #324 | Tragic 28.5% |