Samoan vs Immigrants from North America Bachelor's Degree
COMPARE
Samoan
Immigrants from North America
Bachelor's Degree
Bachelor's Degree Comparison
Samoans
Immigrants from North America
31.8%
BACHELOR'S DEGREE
0.1/ 100
METRIC RATING
275th/ 347
METRIC RANK
41.7%
BACHELOR'S DEGREE
98.5/ 100
METRIC RATING
95th/ 347
METRIC RANK
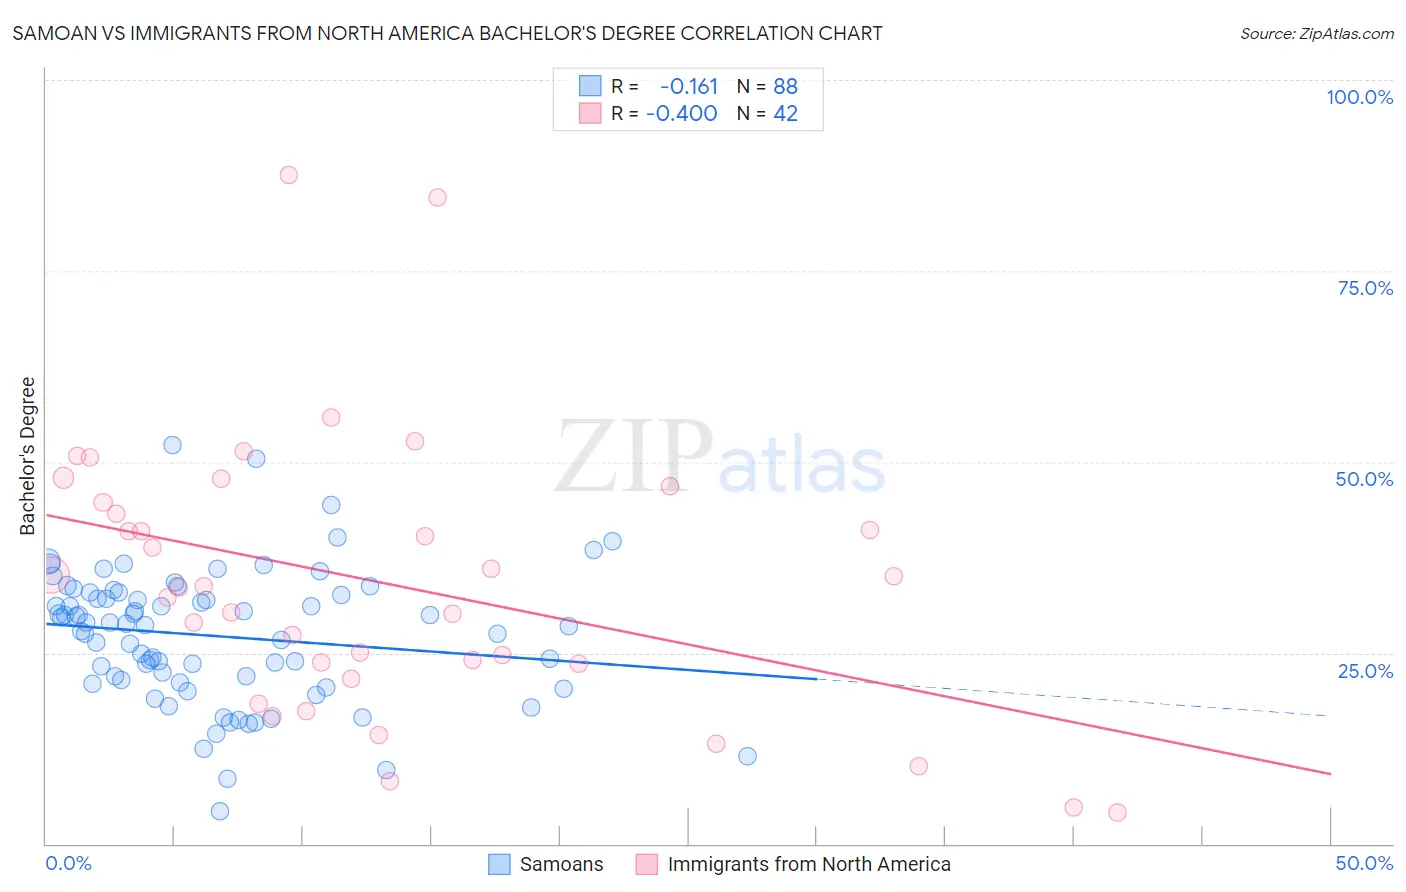
Samoan vs Immigrants from North America Bachelor's Degree Correlation Chart
The statistical analysis conducted on geographies consisting of 225,194,746 people shows a poor negative correlation between the proportion of Samoans and percentage of population with at least bachelor's degree education in the United States with a correlation coefficient (R) of -0.161 and weighted average of 31.8%. Similarly, the statistical analysis conducted on geographies consisting of 462,429,202 people shows a mild negative correlation between the proportion of Immigrants from North America and percentage of population with at least bachelor's degree education in the United States with a correlation coefficient (R) of -0.400 and weighted average of 41.7%, a difference of 30.9%.
Bachelor's Degree Correlation Summary
| Measurement | Samoan | Immigrants from North America |
| Minimum | 4.2% | 4.2% |
| Maximum | 52.2% | 87.6% |
| Range | 48.0% | 83.5% |
| Mean | 27.2% | 34.2% |
| Median | 28.7% | 33.6% |
| Interquartile 25% (IQ1) | 21.2% | 23.5% |
| Interquartile 75% (IQ3) | 32.7% | 44.7% |
| Interquartile Range (IQR) | 11.5% | 21.2% |
| Standard Deviation (Sample) | 8.7% | 18.1% |
| Standard Deviation (Population) | 8.6% | 17.9% |
Similar Demographics by Bachelor's Degree
Demographics Similar to Samoans by Bachelor's Degree
In terms of bachelor's degree, the demographic groups most similar to Samoans are Salvadoran (31.8%, a difference of 0.040%), Potawatomi (31.9%, a difference of 0.13%), American (31.9%, a difference of 0.15%), Dominican (31.8%, a difference of 0.19%), and Marshallese (31.7%, a difference of 0.24%).
| Demographics | Rating | Rank | Bachelor's Degree |
| Immigrants | Portugal | 0.2 /100 | #268 | Tragic 32.2% |
| Immigrants | Belize | 0.2 /100 | #269 | Tragic 32.1% |
| Immigrants | Nicaragua | 0.2 /100 | #270 | Tragic 31.9% |
| Central Americans | 0.2 /100 | #271 | Tragic 31.9% |
| Comanche | 0.2 /100 | #272 | Tragic 31.9% |
| Americans | 0.2 /100 | #273 | Tragic 31.9% |
| Potawatomi | 0.2 /100 | #274 | Tragic 31.9% |
| Samoans | 0.1 /100 | #275 | Tragic 31.8% |
| Salvadorans | 0.1 /100 | #276 | Tragic 31.8% |
| Dominicans | 0.1 /100 | #277 | Tragic 31.8% |
| Marshallese | 0.1 /100 | #278 | Tragic 31.7% |
| Hawaiians | 0.1 /100 | #279 | Tragic 31.6% |
| Immigrants | Laos | 0.1 /100 | #280 | Tragic 31.6% |
| Blackfeet | 0.1 /100 | #281 | Tragic 31.5% |
| Immigrants | Caribbean | 0.1 /100 | #282 | Tragic 31.4% |
Demographics Similar to Immigrants from North America by Bachelor's Degree
In terms of bachelor's degree, the demographic groups most similar to Immigrants from North America are Immigrants from Moldova (41.6%, a difference of 0.11%), Immigrants from Nepal (41.7%, a difference of 0.12%), Immigrants from Canada (41.7%, a difference of 0.15%), Romanian (41.6%, a difference of 0.16%), and Immigrants from Ukraine (41.5%, a difference of 0.27%).
| Demographics | Rating | Rank | Bachelor's Degree |
| Immigrants | Western Europe | 99.0 /100 | #88 | Exceptional 42.0% |
| Greeks | 99.0 /100 | #89 | Exceptional 42.0% |
| Laotians | 98.9 /100 | #90 | Exceptional 42.0% |
| Immigrants | Northern Africa | 98.9 /100 | #91 | Exceptional 41.9% |
| Maltese | 98.8 /100 | #92 | Exceptional 41.9% |
| Immigrants | Canada | 98.6 /100 | #93 | Exceptional 41.7% |
| Immigrants | Nepal | 98.6 /100 | #94 | Exceptional 41.7% |
| Immigrants | North America | 98.5 /100 | #95 | Exceptional 41.7% |
| Immigrants | Moldova | 98.4 /100 | #96 | Exceptional 41.6% |
| Romanians | 98.4 /100 | #97 | Exceptional 41.6% |
| Immigrants | Ukraine | 98.3 /100 | #98 | Exceptional 41.5% |
| Immigrants | England | 98.1 /100 | #99 | Exceptional 41.4% |
| Macedonians | 98.1 /100 | #100 | Exceptional 41.4% |
| Immigrants | Morocco | 98.0 /100 | #101 | Exceptional 41.4% |
| Immigrants | Italy | 97.8 /100 | #102 | Exceptional 41.3% |