Russian vs Immigrants from Senegal Professional Degree
COMPARE
Russian
Immigrants from Senegal
Professional Degree
Professional Degree Comparison
Russians
Immigrants from Senegal
6.3%
PROFESSIONAL DEGREE
100.0/ 100
METRIC RATING
23rd/ 347
METRIC RANK
4.5%
PROFESSIONAL DEGREE
68.0/ 100
METRIC RATING
160th/ 347
METRIC RANK
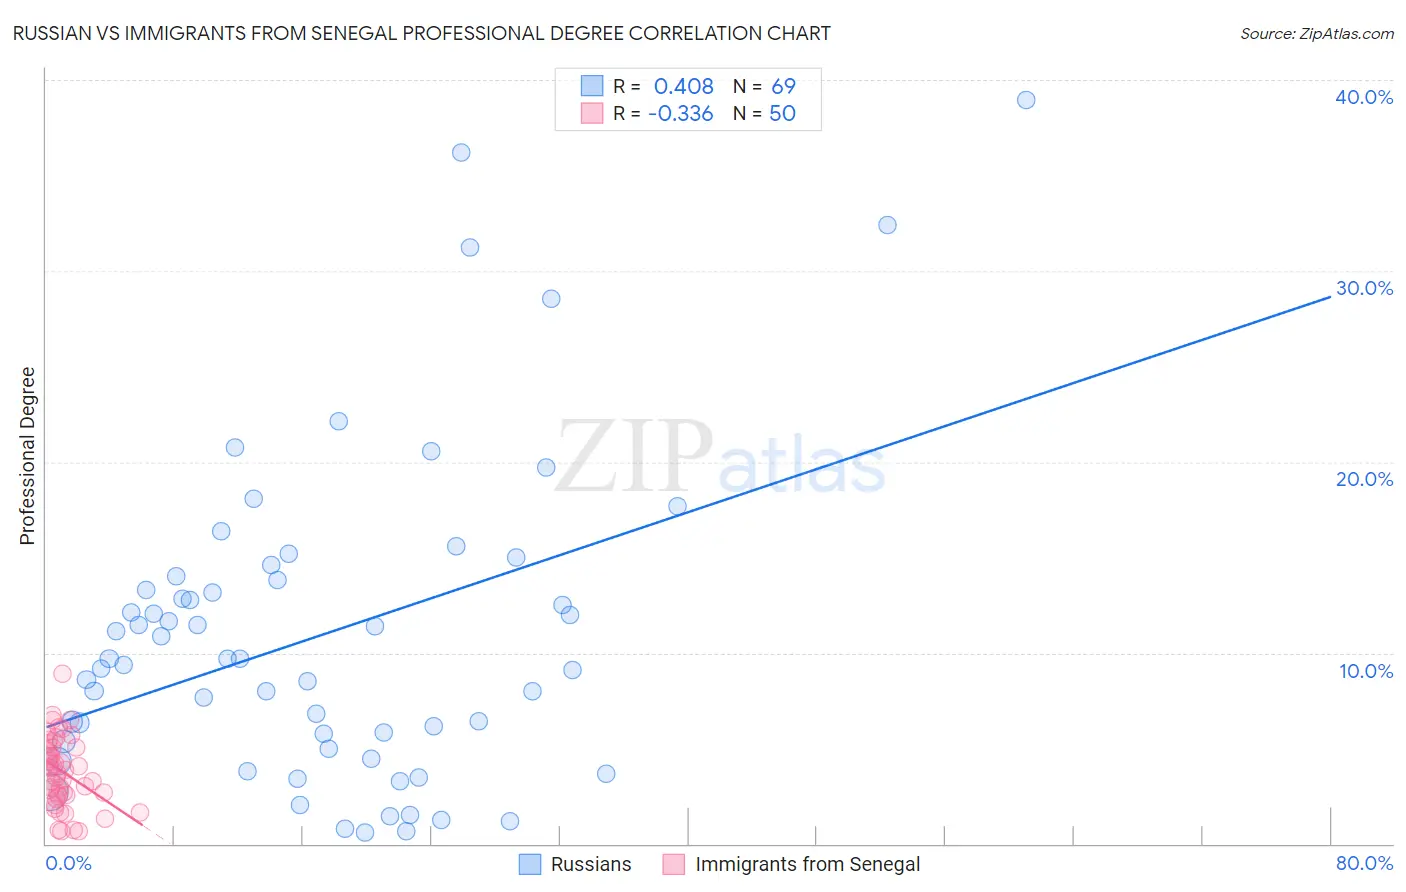
Russian vs Immigrants from Senegal Professional Degree Correlation Chart
The statistical analysis conducted on geographies consisting of 509,341,332 people shows a moderate positive correlation between the proportion of Russians and percentage of population with at least professional degree education in the United States with a correlation coefficient (R) of 0.408 and weighted average of 6.3%. Similarly, the statistical analysis conducted on geographies consisting of 90,094,809 people shows a mild negative correlation between the proportion of Immigrants from Senegal and percentage of population with at least professional degree education in the United States with a correlation coefficient (R) of -0.336 and weighted average of 4.5%, a difference of 39.9%.
Professional Degree Correlation Summary
| Measurement | Russian | Immigrants from Senegal |
| Minimum | 0.56% | 0.65% |
| Maximum | 39.0% | 8.9% |
| Range | 38.4% | 8.3% |
| Mean | 11.0% | 3.8% |
| Median | 9.7% | 3.8% |
| Interquartile 25% (IQ1) | 5.2% | 2.5% |
| Interquartile 75% (IQ3) | 13.9% | 5.0% |
| Interquartile Range (IQR) | 8.7% | 2.5% |
| Standard Deviation (Sample) | 8.3% | 1.8% |
| Standard Deviation (Population) | 8.3% | 1.8% |
Similar Demographics by Professional Degree
Demographics Similar to Russians by Professional Degree
In terms of professional degree, the demographic groups most similar to Russians are Immigrants from Spain (6.3%, a difference of 0.040%), Immigrants from Japan (6.4%, a difference of 0.48%), Immigrants from Ireland (6.3%, a difference of 0.53%), Immigrants from Hong Kong (6.4%, a difference of 1.2%), and Latvian (6.2%, a difference of 1.4%).
| Demographics | Rating | Rank | Professional Degree |
| Immigrants | Sweden | 100.0 /100 | #16 | Exceptional 6.7% |
| Immigrants | Eastern Asia | 100.0 /100 | #17 | Exceptional 6.6% |
| Soviet Union | 100.0 /100 | #18 | Exceptional 6.6% |
| Indians (Asian) | 100.0 /100 | #19 | Exceptional 6.5% |
| Immigrants | Denmark | 100.0 /100 | #20 | Exceptional 6.4% |
| Immigrants | Hong Kong | 100.0 /100 | #21 | Exceptional 6.4% |
| Immigrants | Japan | 100.0 /100 | #22 | Exceptional 6.4% |
| Russians | 100.0 /100 | #23 | Exceptional 6.3% |
| Immigrants | Spain | 100.0 /100 | #24 | Exceptional 6.3% |
| Immigrants | Ireland | 100.0 /100 | #25 | Exceptional 6.3% |
| Latvians | 100.0 /100 | #26 | Exceptional 6.2% |
| Immigrants | Northern Europe | 100.0 /100 | #27 | Exceptional 6.2% |
| Turks | 100.0 /100 | #28 | Exceptional 6.2% |
| Immigrants | Sri Lanka | 100.0 /100 | #29 | Exceptional 6.2% |
| Immigrants | Turkey | 100.0 /100 | #30 | Exceptional 6.2% |
Demographics Similar to Immigrants from Senegal by Professional Degree
In terms of professional degree, the demographic groups most similar to Immigrants from Senegal are Vietnamese (4.5%, a difference of 0.060%), Assyrian/Chaldean/Syriac (4.5%, a difference of 0.10%), Immigrants from Armenia (4.5%, a difference of 0.14%), Iraqi (4.5%, a difference of 0.30%), and Swedish (4.5%, a difference of 0.32%).
| Demographics | Rating | Rank | Professional Degree |
| Immigrants | Uruguay | 72.5 /100 | #153 | Good 4.6% |
| Scottish | 71.8 /100 | #154 | Good 4.6% |
| Slavs | 70.8 /100 | #155 | Good 4.5% |
| Swedes | 69.9 /100 | #156 | Good 4.5% |
| Iraqis | 69.8 /100 | #157 | Good 4.5% |
| Immigrants | Armenia | 68.8 /100 | #158 | Good 4.5% |
| Vietnamese | 68.4 /100 | #159 | Good 4.5% |
| Immigrants | Senegal | 68.0 /100 | #160 | Good 4.5% |
| Assyrians/Chaldeans/Syriacs | 67.4 /100 | #161 | Good 4.5% |
| Peruvians | 65.2 /100 | #162 | Good 4.5% |
| Sierra Leoneans | 64.3 /100 | #163 | Good 4.5% |
| Swiss | 61.0 /100 | #164 | Good 4.5% |
| Costa Ricans | 59.9 /100 | #165 | Average 4.5% |
| Immigrants | Colombia | 59.4 /100 | #166 | Average 4.5% |
| Immigrants | Afghanistan | 59.2 /100 | #167 | Average 4.5% |