Russian vs Immigrants from Senegal 6th Grade
COMPARE
Russian
Immigrants from Senegal
6th Grade
6th Grade Comparison
Russians
Immigrants from Senegal
97.7%
6TH GRADE
99.7/ 100
METRIC RATING
63rd/ 347
METRIC RANK
96.5%
6TH GRADE
0.7/ 100
METRIC RATING
251st/ 347
METRIC RANK
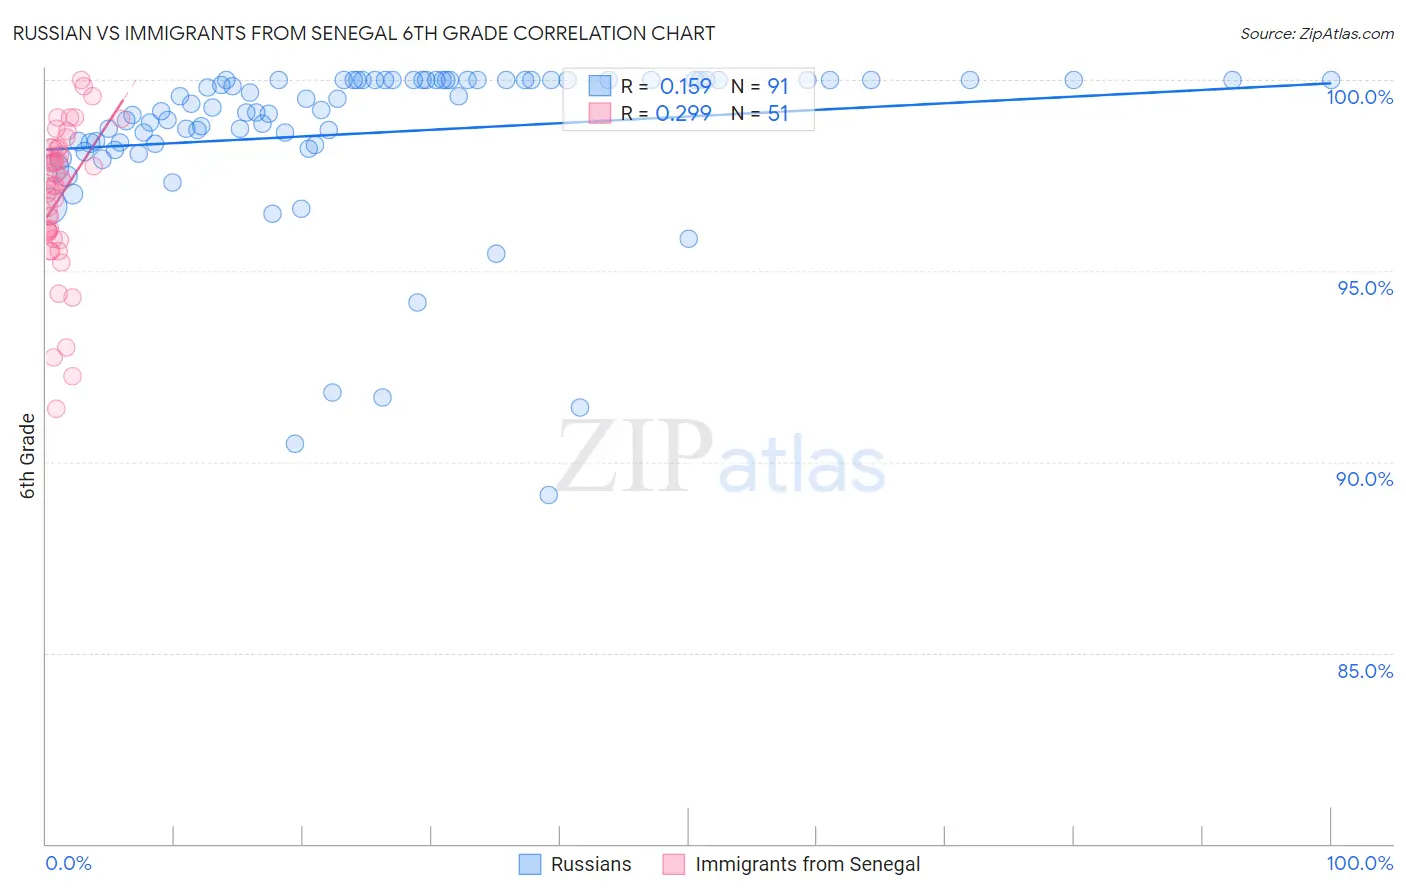
Russian vs Immigrants from Senegal 6th Grade Correlation Chart
The statistical analysis conducted on geographies consisting of 512,259,047 people shows a poor positive correlation between the proportion of Russians and percentage of population with at least 6th grade education in the United States with a correlation coefficient (R) of 0.159 and weighted average of 97.7%. Similarly, the statistical analysis conducted on geographies consisting of 90,119,306 people shows a weak positive correlation between the proportion of Immigrants from Senegal and percentage of population with at least 6th grade education in the United States with a correlation coefficient (R) of 0.299 and weighted average of 96.5%, a difference of 1.2%.
6th Grade Correlation Summary
| Measurement | Russian | Immigrants from Senegal |
| Minimum | 89.1% | 91.4% |
| Maximum | 100.0% | 100.0% |
| Range | 10.9% | 8.6% |
| Mean | 98.6% | 96.9% |
| Median | 99.3% | 97.3% |
| Interquartile 25% (IQ1) | 98.3% | 96.0% |
| Interquartile 75% (IQ3) | 100.0% | 98.2% |
| Interquartile Range (IQR) | 1.7% | 2.2% |
| Standard Deviation (Sample) | 2.2% | 1.9% |
| Standard Deviation (Population) | 2.2% | 1.9% |
Similar Demographics by 6th Grade
Demographics Similar to Russians by 6th Grade
In terms of 6th grade, the demographic groups most similar to Russians are Immigrants from North America (97.7%, a difference of 0.010%), Canadian (97.7%, a difference of 0.010%), Immigrants from Canada (97.7%, a difference of 0.020%), Serbian (97.7%, a difference of 0.020%), and Immigrants from Northern Europe (97.7%, a difference of 0.020%).
| Demographics | Rating | Rank | 6th Grade |
| Austrians | 99.8 /100 | #56 | Exceptional 97.7% |
| Whites/Caucasians | 99.8 /100 | #57 | Exceptional 97.7% |
| Greeks | 99.8 /100 | #58 | Exceptional 97.7% |
| Americans | 99.8 /100 | #59 | Exceptional 97.7% |
| Immigrants | Canada | 99.8 /100 | #60 | Exceptional 97.7% |
| Serbians | 99.7 /100 | #61 | Exceptional 97.7% |
| Immigrants | North America | 99.7 /100 | #62 | Exceptional 97.7% |
| Russians | 99.7 /100 | #63 | Exceptional 97.7% |
| Canadians | 99.7 /100 | #64 | Exceptional 97.7% |
| Immigrants | Northern Europe | 99.6 /100 | #65 | Exceptional 97.7% |
| New Zealanders | 99.6 /100 | #66 | Exceptional 97.7% |
| Kiowa | 99.6 /100 | #67 | Exceptional 97.7% |
| Immigrants | Austria | 99.6 /100 | #68 | Exceptional 97.7% |
| Iranians | 99.6 /100 | #69 | Exceptional 97.6% |
| Cajuns | 99.5 /100 | #70 | Exceptional 97.6% |
Demographics Similar to Immigrants from Senegal by 6th Grade
In terms of 6th grade, the demographic groups most similar to Immigrants from Senegal are Immigrants from Uruguay (96.5%, a difference of 0.010%), Jamaican (96.5%, a difference of 0.010%), Immigrants from Middle Africa (96.5%, a difference of 0.020%), Immigrants from Ethiopia (96.5%, a difference of 0.020%), and Immigrants from Congo (96.5%, a difference of 0.020%).
| Demographics | Rating | Rank | 6th Grade |
| Ethiopians | 1.5 /100 | #244 | Tragic 96.6% |
| Immigrants | Costa Rica | 1.3 /100 | #245 | Tragic 96.6% |
| Immigrants | Africa | 1.3 /100 | #246 | Tragic 96.6% |
| Bolivians | 1.0 /100 | #247 | Tragic 96.5% |
| Tohono O'odham | 1.0 /100 | #248 | Tragic 96.5% |
| Colombians | 0.9 /100 | #249 | Tragic 96.5% |
| Immigrants | Middle Africa | 0.8 /100 | #250 | Tragic 96.5% |
| Immigrants | Senegal | 0.7 /100 | #251 | Tragic 96.5% |
| Immigrants | Uruguay | 0.6 /100 | #252 | Tragic 96.5% |
| Jamaicans | 0.6 /100 | #253 | Tragic 96.5% |
| Immigrants | Ethiopia | 0.6 /100 | #254 | Tragic 96.5% |
| Immigrants | Congo | 0.6 /100 | #255 | Tragic 96.5% |
| U.S. Virgin Islanders | 0.5 /100 | #256 | Tragic 96.5% |
| Taiwanese | 0.5 /100 | #257 | Tragic 96.5% |
| Immigrants | China | 0.4 /100 | #258 | Tragic 96.4% |