Argentinean vs Immigrants from Senegal GED/Equivalency
COMPARE
Argentinean
Immigrants from Senegal
GED/Equivalency
GED/Equivalency Comparison
Argentineans
Immigrants from Senegal
86.7%
GED/EQUIVALENCY
89.7/ 100
METRIC RATING
127th/ 347
METRIC RANK
83.8%
GED/EQUIVALENCY
1.2/ 100
METRIC RATING
245th/ 347
METRIC RANK
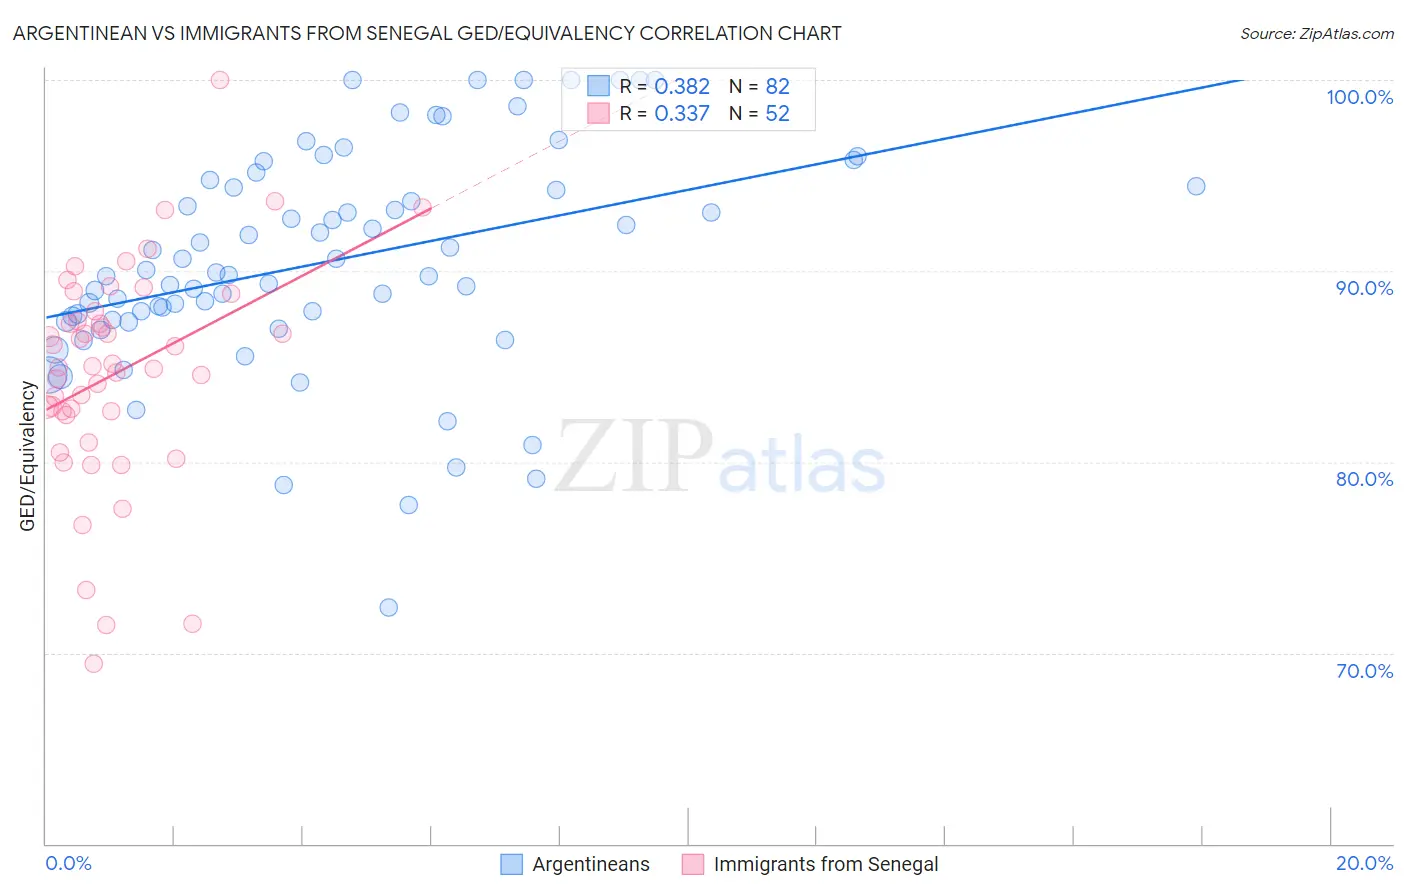
Argentinean vs Immigrants from Senegal GED/Equivalency Correlation Chart
The statistical analysis conducted on geographies consisting of 297,143,432 people shows a mild positive correlation between the proportion of Argentineans and percentage of population with at least ged/equivalency education in the United States with a correlation coefficient (R) of 0.382 and weighted average of 86.7%. Similarly, the statistical analysis conducted on geographies consisting of 90,130,297 people shows a mild positive correlation between the proportion of Immigrants from Senegal and percentage of population with at least ged/equivalency education in the United States with a correlation coefficient (R) of 0.337 and weighted average of 83.8%, a difference of 3.4%.
GED/Equivalency Correlation Summary
| Measurement | Argentinean | Immigrants from Senegal |
| Minimum | 72.4% | 69.5% |
| Maximum | 100.0% | 100.0% |
| Range | 27.6% | 30.5% |
| Mean | 90.5% | 84.7% |
| Median | 89.9% | 85.0% |
| Interquartile 25% (IQ1) | 87.5% | 82.5% |
| Interquartile 75% (IQ3) | 94.5% | 87.6% |
| Interquartile Range (IQR) | 7.0% | 5.1% |
| Standard Deviation (Sample) | 5.8% | 5.8% |
| Standard Deviation (Population) | 5.7% | 5.7% |
Similar Demographics by GED/Equivalency
Demographics Similar to Argentineans by GED/Equivalency
In terms of ged/equivalency, the demographic groups most similar to Argentineans are Yugoslavian (86.7%, a difference of 0.010%), Asian (86.7%, a difference of 0.030%), Immigrants from Egypt (86.7%, a difference of 0.040%), Celtic (86.7%, a difference of 0.040%), and Immigrants from Ukraine (86.7%, a difference of 0.040%).
| Demographics | Rating | Rank | GED/Equivalency |
| Scotch-Irish | 91.6 /100 | #120 | Exceptional 86.8% |
| Immigrants | Lebanon | 90.9 /100 | #121 | Exceptional 86.8% |
| Immigrants | Jordan | 90.8 /100 | #122 | Exceptional 86.8% |
| Immigrants | Italy | 90.5 /100 | #123 | Exceptional 86.7% |
| Immigrants | Egypt | 90.4 /100 | #124 | Exceptional 86.7% |
| Celtics | 90.4 /100 | #125 | Exceptional 86.7% |
| Asians | 90.3 /100 | #126 | Exceptional 86.7% |
| Argentineans | 89.7 /100 | #127 | Excellent 86.7% |
| Yugoslavians | 89.5 /100 | #128 | Excellent 86.7% |
| Immigrants | Ukraine | 88.9 /100 | #129 | Excellent 86.7% |
| Immigrants | Germany | 88.8 /100 | #130 | Excellent 86.7% |
| Immigrants | Spain | 88.5 /100 | #131 | Excellent 86.7% |
| Immigrants | Brazil | 88.4 /100 | #132 | Excellent 86.6% |
| Tsimshian | 88.3 /100 | #133 | Excellent 86.6% |
| Albanians | 87.7 /100 | #134 | Excellent 86.6% |
Demographics Similar to Immigrants from Senegal by GED/Equivalency
In terms of ged/equivalency, the demographic groups most similar to Immigrants from Senegal are Chickasaw (83.8%, a difference of 0.020%), Immigrants from Ghana (83.9%, a difference of 0.030%), Cherokee (83.9%, a difference of 0.040%), Immigrants from Western Africa (83.8%, a difference of 0.050%), and Blackfeet (83.8%, a difference of 0.070%).
| Demographics | Rating | Rank | GED/Equivalency |
| Immigrants | Peru | 2.7 /100 | #238 | Tragic 84.2% |
| Immigrants | Bahamas | 2.6 /100 | #239 | Tragic 84.2% |
| Immigrants | South Eastern Asia | 2.5 /100 | #240 | Tragic 84.1% |
| Senegalese | 1.9 /100 | #241 | Tragic 84.0% |
| Sri Lankans | 1.9 /100 | #242 | Tragic 84.0% |
| Cherokee | 1.3 /100 | #243 | Tragic 83.9% |
| Immigrants | Ghana | 1.3 /100 | #244 | Tragic 83.9% |
| Immigrants | Senegal | 1.2 /100 | #245 | Tragic 83.8% |
| Chickasaw | 1.2 /100 | #246 | Tragic 83.8% |
| Immigrants | Western Africa | 1.1 /100 | #247 | Tragic 83.8% |
| Blackfeet | 1.1 /100 | #248 | Tragic 83.8% |
| Crow | 1.1 /100 | #249 | Tragic 83.8% |
| Shoshone | 1.0 /100 | #250 | Tragic 83.7% |
| Spanish Americans | 0.8 /100 | #251 | Tragic 83.6% |
| Bahamians | 0.8 /100 | #252 | Tragic 83.6% |