Romanian vs Immigrants from Romania Master's Degree
COMPARE
Romanian
Immigrants from Romania
Master's Degree
Master's Degree Comparison
Romanians
Immigrants from Romania
17.2%
MASTER'S DEGREE
99.1/ 100
METRIC RATING
91st/ 347
METRIC RANK
17.7%
MASTER'S DEGREE
99.7/ 100
METRIC RATING
74th/ 347
METRIC RANK
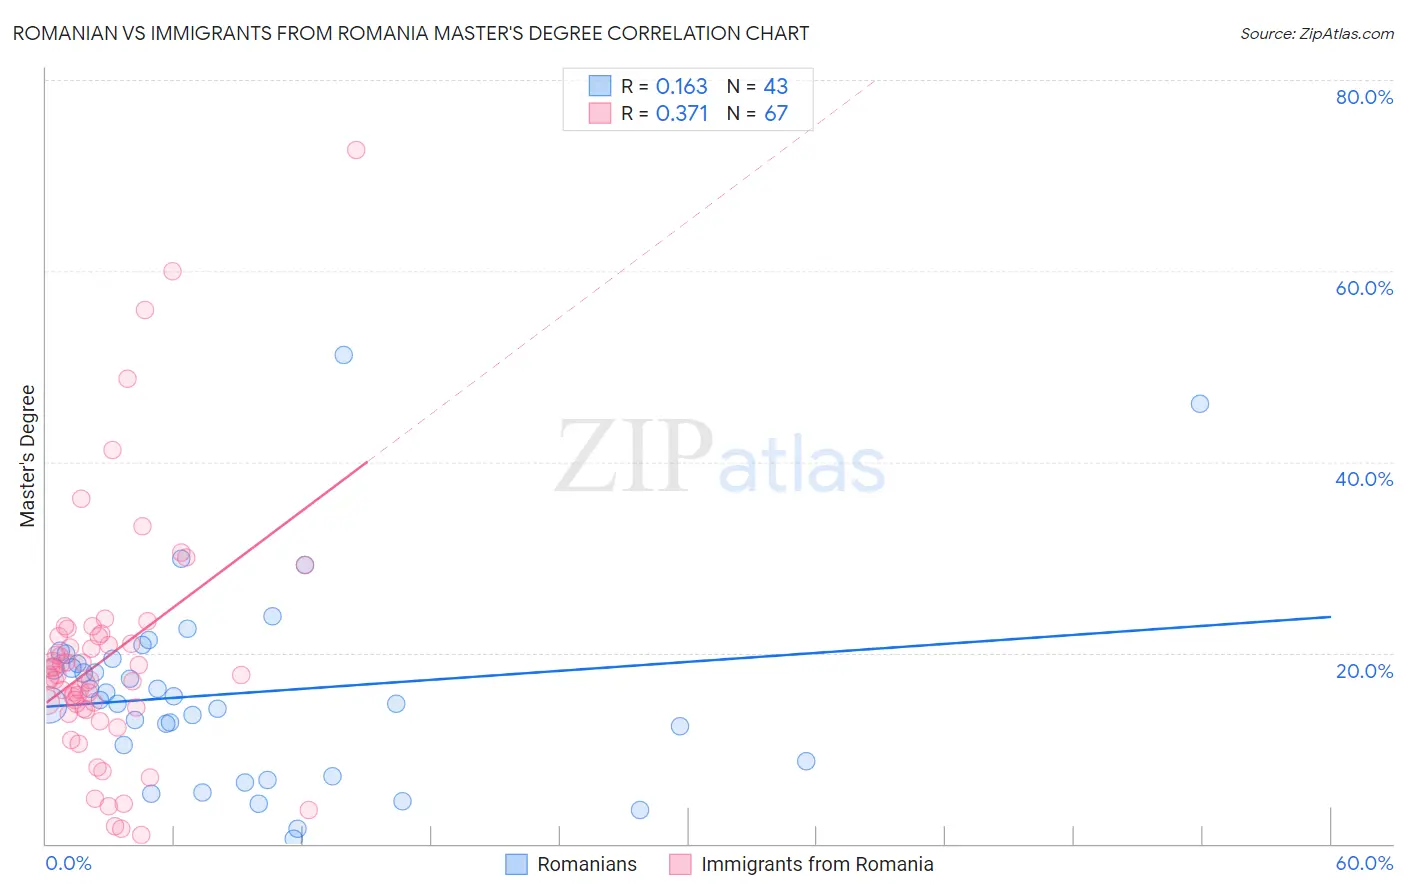
Romanian vs Immigrants from Romania Master's Degree Correlation Chart
The statistical analysis conducted on geographies consisting of 377,825,109 people shows a poor positive correlation between the proportion of Romanians and percentage of population with at least master's degree education in the United States with a correlation coefficient (R) of 0.163 and weighted average of 17.2%. Similarly, the statistical analysis conducted on geographies consisting of 256,994,499 people shows a mild positive correlation between the proportion of Immigrants from Romania and percentage of population with at least master's degree education in the United States with a correlation coefficient (R) of 0.371 and weighted average of 17.7%, a difference of 2.9%.
Master's Degree Correlation Summary
| Measurement | Romanian | Immigrants from Romania |
| Minimum | 0.58% | 0.91% |
| Maximum | 51.2% | 72.6% |
| Range | 50.6% | 71.7% |
| Mean | 15.8% | 19.6% |
| Median | 15.1% | 17.5% |
| Interquartile 25% (IQ1) | 8.6% | 14.1% |
| Interquartile 75% (IQ3) | 19.4% | 21.8% |
| Interquartile Range (IQR) | 10.7% | 7.7% |
| Standard Deviation (Sample) | 10.1% | 12.9% |
| Standard Deviation (Population) | 9.9% | 12.8% |
Demographics Similar to Romanians and Immigrants from Romania by Master's Degree
In terms of master's degree, the demographic groups most similar to Romanians are Immigrants from North America (17.2%, a difference of 0.050%), Immigrants from Egypt (17.2%, a difference of 0.070%), Bhutanese (17.2%, a difference of 0.090%), Immigrants from Canada (17.2%, a difference of 0.16%), and Maltese (17.3%, a difference of 0.52%). Similarly, the demographic groups most similar to Immigrants from Romania are Zimbabwean (17.7%, a difference of 0.31%), Egyptian (17.6%, a difference of 0.38%), Immigrants from Indonesia (17.6%, a difference of 0.40%), Lithuanian (17.7%, a difference of 0.41%), and Immigrants from Eastern Europe (17.6%, a difference of 0.52%).
| Demographics | Rating | Rank | Master's Degree |
| Lithuanians | 99.7 /100 | #72 | Exceptional 17.7% |
| Zimbabweans | 99.7 /100 | #73 | Exceptional 17.7% |
| Immigrants | Romania | 99.7 /100 | #74 | Exceptional 17.7% |
| Egyptians | 99.6 /100 | #75 | Exceptional 17.6% |
| Immigrants | Indonesia | 99.6 /100 | #76 | Exceptional 17.6% |
| Immigrants | Eastern Europe | 99.6 /100 | #77 | Exceptional 17.6% |
| Immigrants | Hungary | 99.6 /100 | #78 | Exceptional 17.5% |
| Immigrants | Lebanon | 99.6 /100 | #79 | Exceptional 17.5% |
| Carpatho Rusyns | 99.6 /100 | #80 | Exceptional 17.5% |
| Immigrants | Western Asia | 99.5 /100 | #81 | Exceptional 17.5% |
| Greeks | 99.5 /100 | #82 | Exceptional 17.5% |
| Immigrants | Zimbabwe | 99.5 /100 | #83 | Exceptional 17.4% |
| Immigrants | Scotland | 99.4 /100 | #84 | Exceptional 17.4% |
| Immigrants | Brazil | 99.4 /100 | #85 | Exceptional 17.4% |
| Immigrants | Croatia | 99.3 /100 | #86 | Exceptional 17.3% |
| Maltese | 99.3 /100 | #87 | Exceptional 17.3% |
| Immigrants | Canada | 99.2 /100 | #88 | Exceptional 17.2% |
| Bhutanese | 99.1 /100 | #89 | Exceptional 17.2% |
| Immigrants | Egypt | 99.1 /100 | #90 | Exceptional 17.2% |
| Romanians | 99.1 /100 | #91 | Exceptional 17.2% |
| Immigrants | North America | 99.1 /100 | #92 | Exceptional 17.2% |