Romanian vs Immigrants from Thailand Master's Degree
COMPARE
Romanian
Immigrants from Thailand
Master's Degree
Master's Degree Comparison
Romanians
Immigrants from Thailand
17.2%
MASTER'S DEGREE
99.1/ 100
METRIC RATING
91st/ 347
METRIC RANK
14.2%
MASTER'S DEGREE
17.0/ 100
METRIC RATING
213th/ 347
METRIC RANK
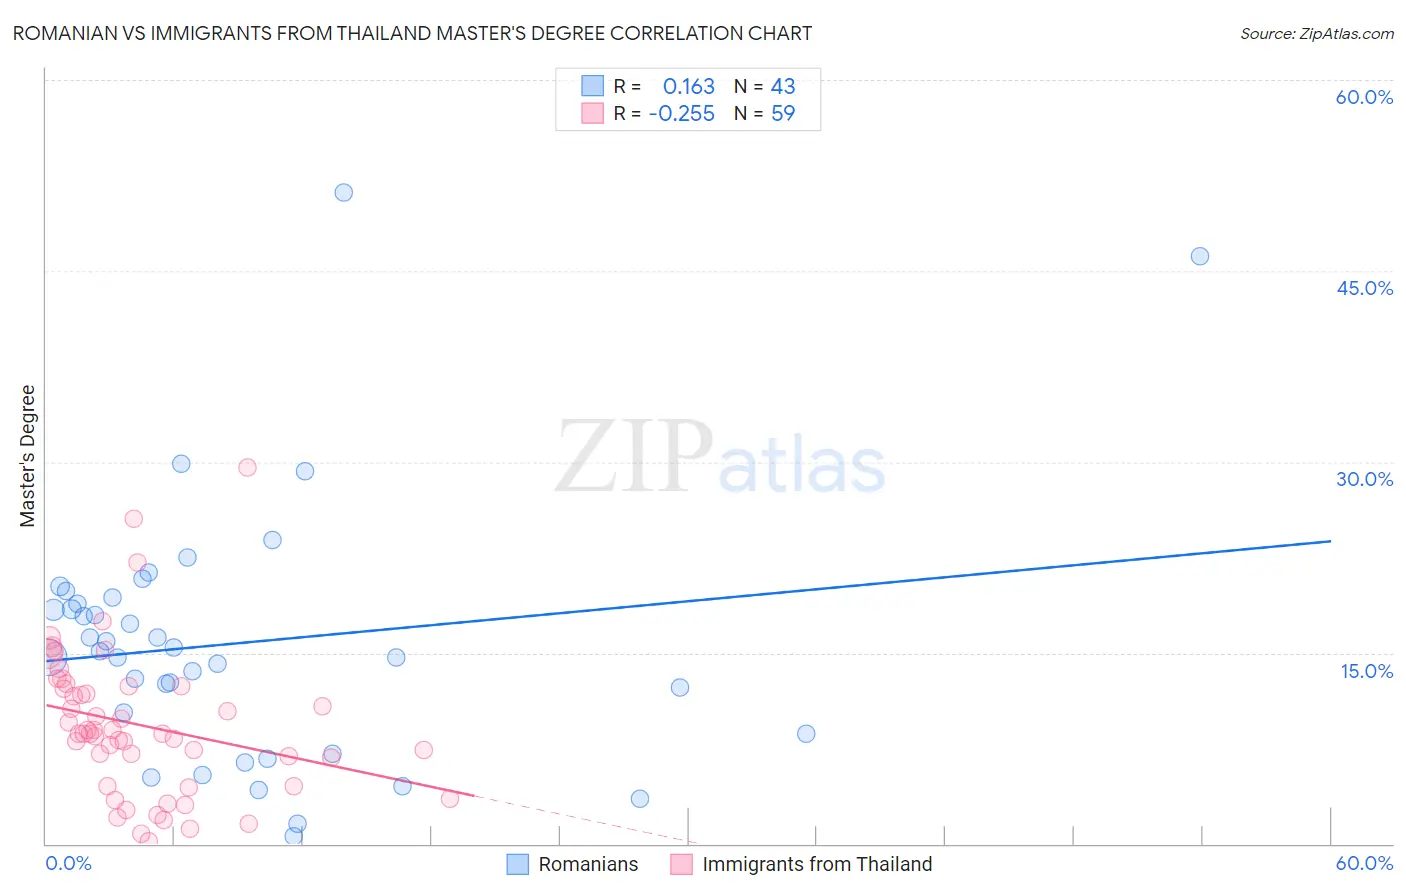
Romanian vs Immigrants from Thailand Master's Degree Correlation Chart
The statistical analysis conducted on geographies consisting of 377,825,109 people shows a poor positive correlation between the proportion of Romanians and percentage of population with at least master's degree education in the United States with a correlation coefficient (R) of 0.163 and weighted average of 17.2%. Similarly, the statistical analysis conducted on geographies consisting of 316,948,216 people shows a weak negative correlation between the proportion of Immigrants from Thailand and percentage of population with at least master's degree education in the United States with a correlation coefficient (R) of -0.255 and weighted average of 14.2%, a difference of 21.2%.
Master's Degree Correlation Summary
| Measurement | Romanian | Immigrants from Thailand |
| Minimum | 0.58% | 0.16% |
| Maximum | 51.2% | 29.5% |
| Range | 50.6% | 29.4% |
| Mean | 15.8% | 9.3% |
| Median | 15.1% | 8.7% |
| Interquartile 25% (IQ1) | 8.6% | 4.5% |
| Interquartile 75% (IQ3) | 19.4% | 12.3% |
| Interquartile Range (IQR) | 10.7% | 7.8% |
| Standard Deviation (Sample) | 10.1% | 5.8% |
| Standard Deviation (Population) | 9.9% | 5.7% |
Similar Demographics by Master's Degree
Demographics Similar to Romanians by Master's Degree
In terms of master's degree, the demographic groups most similar to Romanians are Immigrants from North America (17.2%, a difference of 0.050%), Immigrants from Egypt (17.2%, a difference of 0.070%), Bhutanese (17.2%, a difference of 0.090%), Immigrants from Italy (17.2%, a difference of 0.11%), and Immigrants from Canada (17.2%, a difference of 0.16%).
| Demographics | Rating | Rank | Master's Degree |
| Immigrants | Scotland | 99.4 /100 | #84 | Exceptional 17.4% |
| Immigrants | Brazil | 99.4 /100 | #85 | Exceptional 17.4% |
| Immigrants | Croatia | 99.3 /100 | #86 | Exceptional 17.3% |
| Maltese | 99.3 /100 | #87 | Exceptional 17.3% |
| Immigrants | Canada | 99.2 /100 | #88 | Exceptional 17.2% |
| Bhutanese | 99.1 /100 | #89 | Exceptional 17.2% |
| Immigrants | Egypt | 99.1 /100 | #90 | Exceptional 17.2% |
| Romanians | 99.1 /100 | #91 | Exceptional 17.2% |
| Immigrants | North America | 99.1 /100 | #92 | Exceptional 17.2% |
| Immigrants | Italy | 99.1 /100 | #93 | Exceptional 17.2% |
| Ugandans | 99.0 /100 | #94 | Exceptional 17.1% |
| Immigrants | Morocco | 98.9 /100 | #95 | Exceptional 17.1% |
| Immigrants | Northern Africa | 98.9 /100 | #96 | Exceptional 17.1% |
| Immigrants | England | 98.8 /100 | #97 | Exceptional 17.0% |
| Immigrants | Ukraine | 98.8 /100 | #98 | Exceptional 17.0% |
Demographics Similar to Immigrants from Thailand by Master's Degree
In terms of master's degree, the demographic groups most similar to Immigrants from Thailand are Finnish (14.2%, a difference of 0.010%), Spanish (14.2%, a difference of 0.19%), Immigrants from Vietnam (14.1%, a difference of 0.22%), Somali (14.2%, a difference of 0.24%), and Immigrants from Somalia (14.1%, a difference of 0.29%).
| Demographics | Rating | Rank | Master's Degree |
| Scandinavians | 23.3 /100 | #206 | Fair 14.4% |
| Immigrants | Bosnia and Herzegovina | 22.0 /100 | #207 | Fair 14.3% |
| Immigrants | Barbados | 20.5 /100 | #208 | Fair 14.3% |
| Immigrants | Panama | 20.0 /100 | #209 | Fair 14.3% |
| Sub-Saharan Africans | 19.4 /100 | #210 | Poor 14.2% |
| Somalis | 18.0 /100 | #211 | Poor 14.2% |
| Spanish | 17.8 /100 | #212 | Poor 14.2% |
| Immigrants | Thailand | 17.0 /100 | #213 | Poor 14.2% |
| Finns | 16.9 /100 | #214 | Poor 14.2% |
| Immigrants | Vietnam | 16.1 /100 | #215 | Poor 14.1% |
| Immigrants | Somalia | 15.8 /100 | #216 | Poor 14.1% |
| Immigrants | Trinidad and Tobago | 15.8 /100 | #217 | Poor 14.1% |
| French Canadians | 14.9 /100 | #218 | Poor 14.1% |
| Norwegians | 13.6 /100 | #219 | Poor 14.0% |
| Germans | 13.1 /100 | #220 | Poor 14.0% |