Romanian vs Immigrants from Australia Master's Degree
COMPARE
Romanian
Immigrants from Australia
Master's Degree
Master's Degree Comparison
Romanians
Immigrants from Australia
17.2%
MASTER'S DEGREE
99.1/ 100
METRIC RATING
91st/ 347
METRIC RANK
20.9%
MASTER'S DEGREE
100.0/ 100
METRIC RATING
13th/ 347
METRIC RANK
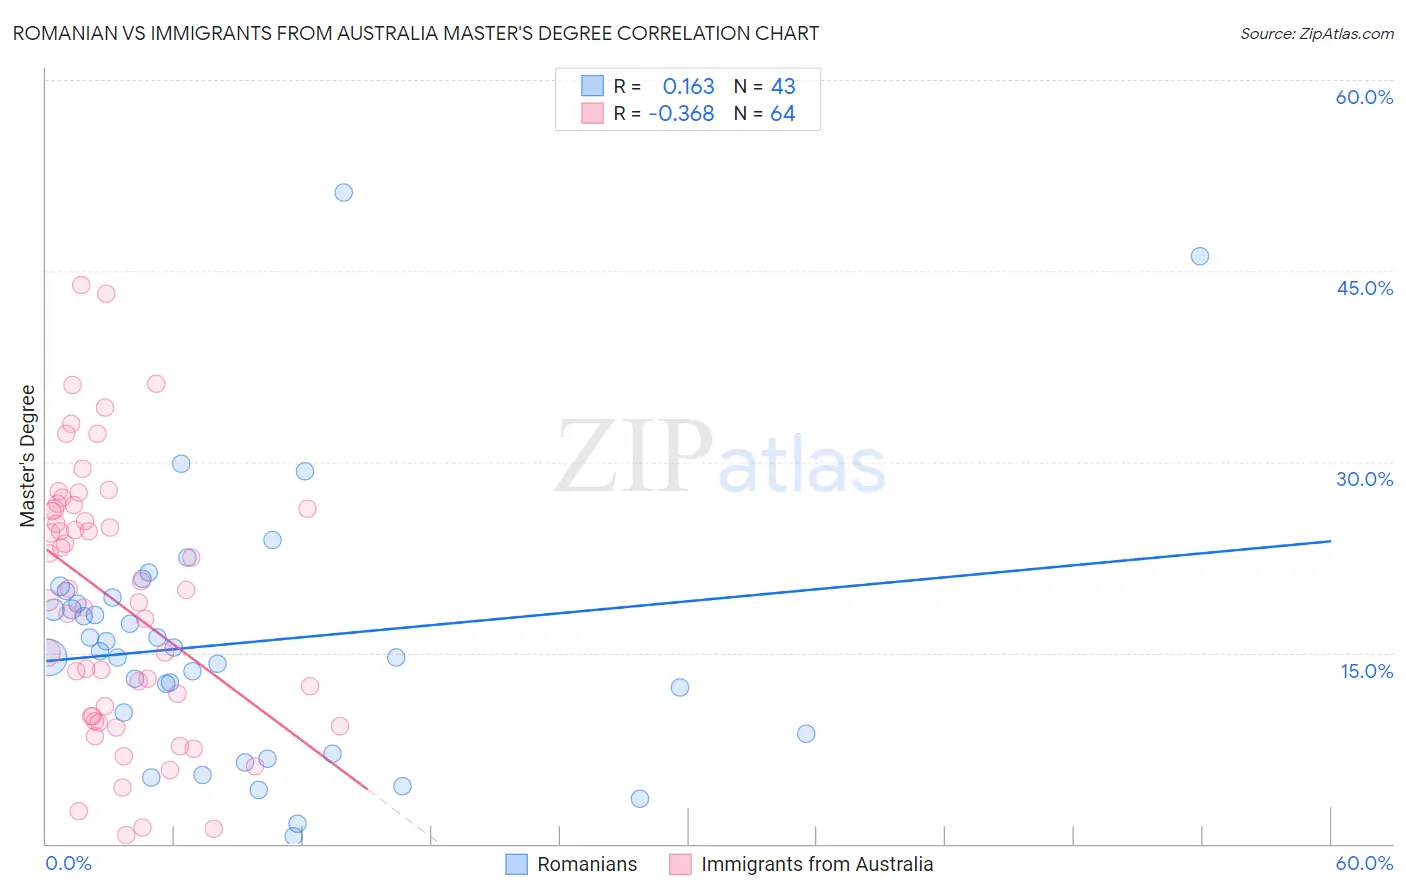
Romanian vs Immigrants from Australia Master's Degree Correlation Chart
The statistical analysis conducted on geographies consisting of 377,825,109 people shows a poor positive correlation between the proportion of Romanians and percentage of population with at least master's degree education in the United States with a correlation coefficient (R) of 0.163 and weighted average of 17.2%. Similarly, the statistical analysis conducted on geographies consisting of 227,173,113 people shows a mild negative correlation between the proportion of Immigrants from Australia and percentage of population with at least master's degree education in the United States with a correlation coefficient (R) of -0.368 and weighted average of 20.9%, a difference of 21.5%.
Master's Degree Correlation Summary
| Measurement | Romanian | Immigrants from Australia |
| Minimum | 0.58% | 0.65% |
| Maximum | 51.2% | 43.9% |
| Range | 50.6% | 43.3% |
| Mean | 15.8% | 19.1% |
| Median | 15.1% | 19.5% |
| Interquartile 25% (IQ1) | 8.6% | 10.0% |
| Interquartile 75% (IQ3) | 19.4% | 26.3% |
| Interquartile Range (IQR) | 10.7% | 16.3% |
| Standard Deviation (Sample) | 10.1% | 10.4% |
| Standard Deviation (Population) | 9.9% | 10.3% |
Similar Demographics by Master's Degree
Demographics Similar to Romanians by Master's Degree
In terms of master's degree, the demographic groups most similar to Romanians are Immigrants from North America (17.2%, a difference of 0.050%), Immigrants from Egypt (17.2%, a difference of 0.070%), Bhutanese (17.2%, a difference of 0.090%), Immigrants from Italy (17.2%, a difference of 0.11%), and Immigrants from Canada (17.2%, a difference of 0.16%).
| Demographics | Rating | Rank | Master's Degree |
| Immigrants | Scotland | 99.4 /100 | #84 | Exceptional 17.4% |
| Immigrants | Brazil | 99.4 /100 | #85 | Exceptional 17.4% |
| Immigrants | Croatia | 99.3 /100 | #86 | Exceptional 17.3% |
| Maltese | 99.3 /100 | #87 | Exceptional 17.3% |
| Immigrants | Canada | 99.2 /100 | #88 | Exceptional 17.2% |
| Bhutanese | 99.1 /100 | #89 | Exceptional 17.2% |
| Immigrants | Egypt | 99.1 /100 | #90 | Exceptional 17.2% |
| Romanians | 99.1 /100 | #91 | Exceptional 17.2% |
| Immigrants | North America | 99.1 /100 | #92 | Exceptional 17.2% |
| Immigrants | Italy | 99.1 /100 | #93 | Exceptional 17.2% |
| Ugandans | 99.0 /100 | #94 | Exceptional 17.1% |
| Immigrants | Morocco | 98.9 /100 | #95 | Exceptional 17.1% |
| Immigrants | Northern Africa | 98.9 /100 | #96 | Exceptional 17.1% |
| Immigrants | England | 98.8 /100 | #97 | Exceptional 17.0% |
| Immigrants | Ukraine | 98.8 /100 | #98 | Exceptional 17.0% |
Demographics Similar to Immigrants from Australia by Master's Degree
In terms of master's degree, the demographic groups most similar to Immigrants from Australia are Immigrants from Switzerland (20.9%, a difference of 0.010%), Immigrants from Eastern Asia (20.8%, a difference of 0.19%), Immigrants from Belgium (20.8%, a difference of 0.48%), Immigrants from South Central Asia (20.7%, a difference of 0.74%), and Eastern European (21.1%, a difference of 1.2%).
| Demographics | Rating | Rank | Master's Degree |
| Immigrants | India | 100.0 /100 | #6 | Exceptional 22.3% |
| Iranians | 100.0 /100 | #7 | Exceptional 22.3% |
| Cypriots | 100.0 /100 | #8 | Exceptional 21.8% |
| Thais | 100.0 /100 | #9 | Exceptional 21.7% |
| Immigrants | Iran | 100.0 /100 | #10 | Exceptional 21.6% |
| Immigrants | China | 100.0 /100 | #11 | Exceptional 21.2% |
| Eastern Europeans | 100.0 /100 | #12 | Exceptional 21.1% |
| Immigrants | Australia | 100.0 /100 | #13 | Exceptional 20.9% |
| Immigrants | Switzerland | 100.0 /100 | #14 | Exceptional 20.9% |
| Immigrants | Eastern Asia | 100.0 /100 | #15 | Exceptional 20.8% |
| Immigrants | Belgium | 100.0 /100 | #16 | Exceptional 20.8% |
| Immigrants | South Central Asia | 100.0 /100 | #17 | Exceptional 20.7% |
| Soviet Union | 100.0 /100 | #18 | Exceptional 20.5% |
| Immigrants | Hong Kong | 100.0 /100 | #19 | Exceptional 20.5% |
| Indians (Asian) | 100.0 /100 | #20 | Exceptional 20.5% |