Romanian vs Immigrants from Dominica Master's Degree
COMPARE
Romanian
Immigrants from Dominica
Master's Degree
Master's Degree Comparison
Romanians
Immigrants from Dominica
17.2%
MASTER'S DEGREE
99.1/ 100
METRIC RATING
91st/ 347
METRIC RANK
12.6%
MASTER'S DEGREE
0.8/ 100
METRIC RATING
253rd/ 347
METRIC RANK
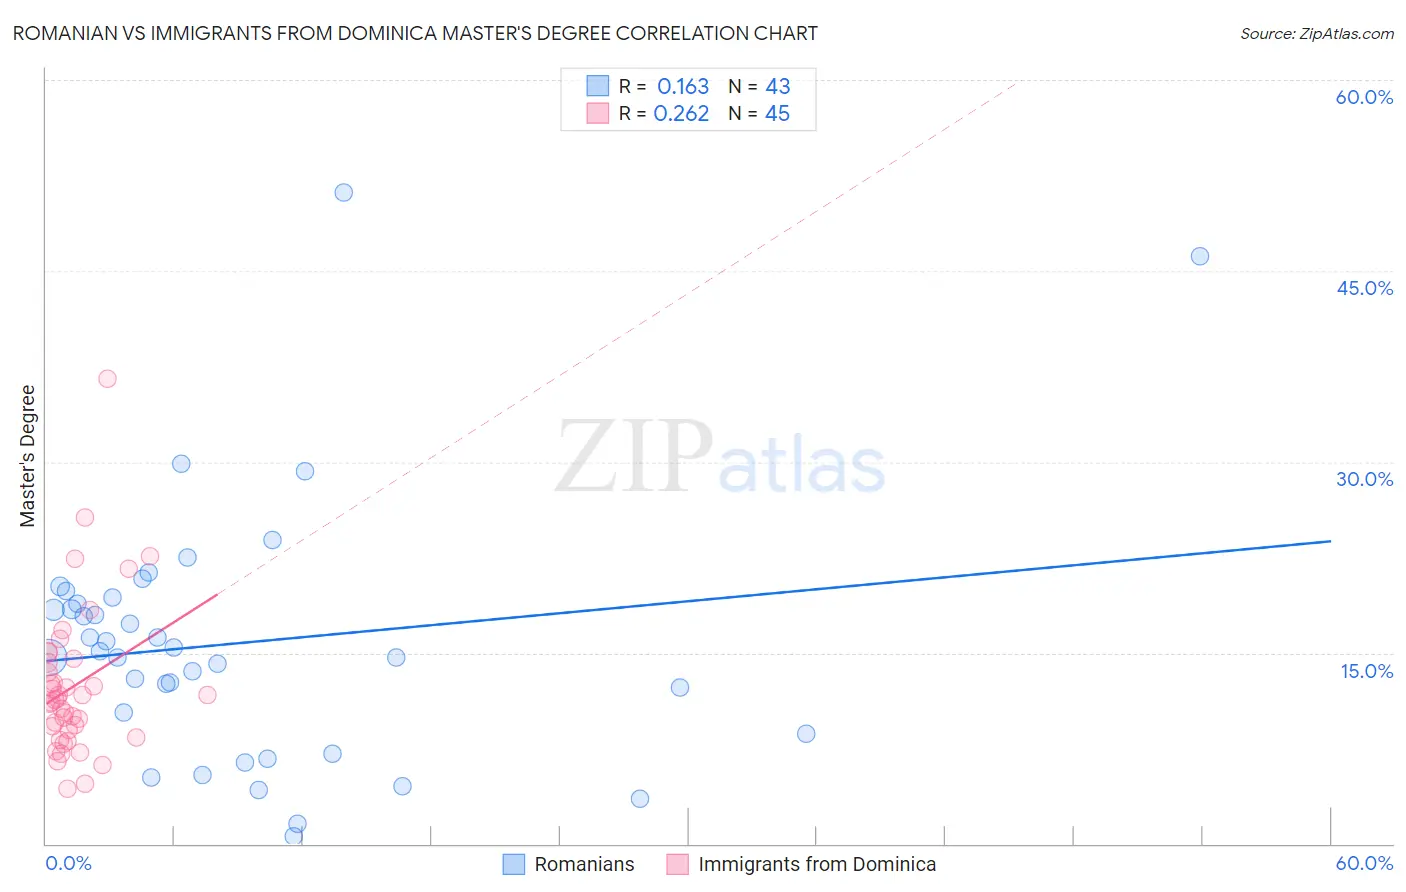
Romanian vs Immigrants from Dominica Master's Degree Correlation Chart
The statistical analysis conducted on geographies consisting of 377,825,109 people shows a poor positive correlation between the proportion of Romanians and percentage of population with at least master's degree education in the United States with a correlation coefficient (R) of 0.163 and weighted average of 17.2%. Similarly, the statistical analysis conducted on geographies consisting of 83,792,666 people shows a weak positive correlation between the proportion of Immigrants from Dominica and percentage of population with at least master's degree education in the United States with a correlation coefficient (R) of 0.262 and weighted average of 12.6%, a difference of 35.8%.
Master's Degree Correlation Summary
| Measurement | Romanian | Immigrants from Dominica |
| Minimum | 0.58% | 4.3% |
| Maximum | 51.2% | 36.5% |
| Range | 50.6% | 32.3% |
| Mean | 15.8% | 12.4% |
| Median | 15.1% | 11.3% |
| Interquartile 25% (IQ1) | 8.6% | 8.6% |
| Interquartile 75% (IQ3) | 19.4% | 14.4% |
| Interquartile Range (IQR) | 10.7% | 5.7% |
| Standard Deviation (Sample) | 10.1% | 6.0% |
| Standard Deviation (Population) | 9.9% | 5.9% |
Similar Demographics by Master's Degree
Demographics Similar to Romanians by Master's Degree
In terms of master's degree, the demographic groups most similar to Romanians are Immigrants from North America (17.2%, a difference of 0.050%), Immigrants from Egypt (17.2%, a difference of 0.070%), Bhutanese (17.2%, a difference of 0.090%), Immigrants from Italy (17.2%, a difference of 0.11%), and Immigrants from Canada (17.2%, a difference of 0.16%).
| Demographics | Rating | Rank | Master's Degree |
| Immigrants | Scotland | 99.4 /100 | #84 | Exceptional 17.4% |
| Immigrants | Brazil | 99.4 /100 | #85 | Exceptional 17.4% |
| Immigrants | Croatia | 99.3 /100 | #86 | Exceptional 17.3% |
| Maltese | 99.3 /100 | #87 | Exceptional 17.3% |
| Immigrants | Canada | 99.2 /100 | #88 | Exceptional 17.2% |
| Bhutanese | 99.1 /100 | #89 | Exceptional 17.2% |
| Immigrants | Egypt | 99.1 /100 | #90 | Exceptional 17.2% |
| Romanians | 99.1 /100 | #91 | Exceptional 17.2% |
| Immigrants | North America | 99.1 /100 | #92 | Exceptional 17.2% |
| Immigrants | Italy | 99.1 /100 | #93 | Exceptional 17.2% |
| Ugandans | 99.0 /100 | #94 | Exceptional 17.1% |
| Immigrants | Morocco | 98.9 /100 | #95 | Exceptional 17.1% |
| Immigrants | Northern Africa | 98.9 /100 | #96 | Exceptional 17.1% |
| Immigrants | England | 98.8 /100 | #97 | Exceptional 17.0% |
| Immigrants | Ukraine | 98.8 /100 | #98 | Exceptional 17.0% |
Demographics Similar to Immigrants from Dominica by Master's Degree
In terms of master's degree, the demographic groups most similar to Immigrants from Dominica are Indonesian (12.6%, a difference of 0.040%), Immigrants from Congo (12.6%, a difference of 0.070%), Immigrants from Portugal (12.6%, a difference of 0.14%), French American Indian (12.7%, a difference of 0.54%), and Osage (12.6%, a difference of 0.62%).
| Demographics | Rating | Rank | Master's Degree |
| Immigrants | Cambodia | 1.4 /100 | #246 | Tragic 12.9% |
| Iroquois | 1.4 /100 | #247 | Tragic 12.9% |
| Africans | 1.4 /100 | #248 | Tragic 12.9% |
| Cree | 1.3 /100 | #249 | Tragic 12.8% |
| Liberians | 1.3 /100 | #250 | Tragic 12.8% |
| Tlingit-Haida | 1.3 /100 | #251 | Tragic 12.8% |
| French American Indians | 1.0 /100 | #252 | Tragic 12.7% |
| Immigrants | Dominica | 0.8 /100 | #253 | Tragic 12.6% |
| Indonesians | 0.8 /100 | #254 | Tragic 12.6% |
| Immigrants | Congo | 0.8 /100 | #255 | Tragic 12.6% |
| Immigrants | Portugal | 0.8 /100 | #256 | Tragic 12.6% |
| Osage | 0.7 /100 | #257 | Tragic 12.6% |
| Immigrants | Liberia | 0.6 /100 | #258 | Tragic 12.5% |
| Japanese | 0.6 /100 | #259 | Tragic 12.5% |
| Dominicans | 0.6 /100 | #260 | Tragic 12.5% |