Potawatomi vs Fijian Associate's Degree
COMPARE
Potawatomi
Fijian
Associate's Degree
Associate's Degree Comparison
Potawatomi
Fijians
40.4%
ASSOCIATE'S DEGREE
0.1/ 100
METRIC RATING
275th/ 347
METRIC RANK
37.4%
ASSOCIATE'S DEGREE
0.0/ 100
METRIC RATING
319th/ 347
METRIC RANK
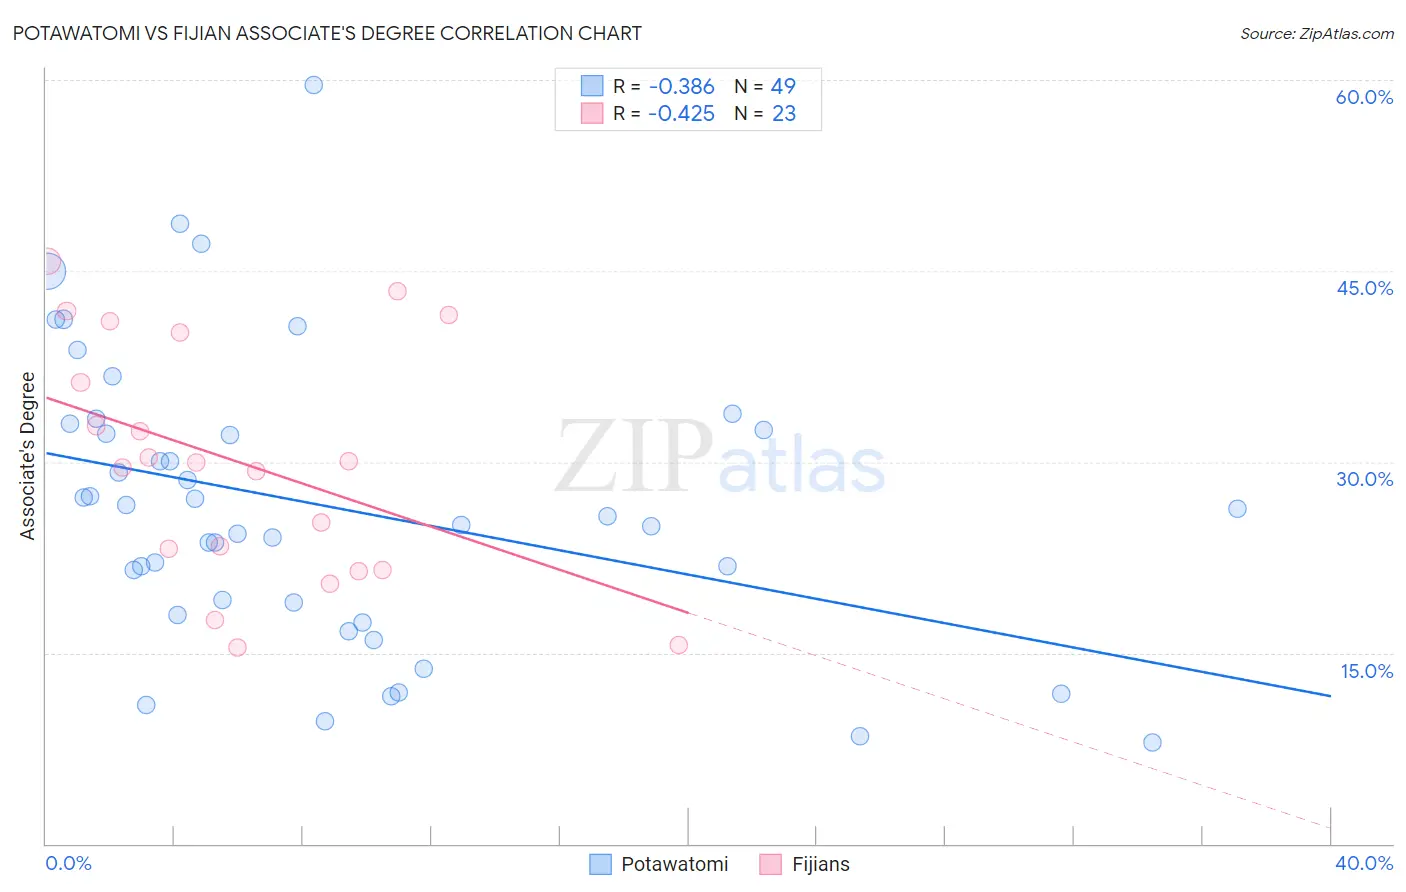
Potawatomi vs Fijian Associate's Degree Correlation Chart
The statistical analysis conducted on geographies consisting of 117,773,349 people shows a mild negative correlation between the proportion of Potawatomi and percentage of population with at least associate's degree education in the United States with a correlation coefficient (R) of -0.386 and weighted average of 40.4%. Similarly, the statistical analysis conducted on geographies consisting of 55,948,669 people shows a moderate negative correlation between the proportion of Fijians and percentage of population with at least associate's degree education in the United States with a correlation coefficient (R) of -0.425 and weighted average of 37.4%, a difference of 8.1%.
Associate's Degree Correlation Summary
| Measurement | Potawatomi | Fijian |
| Minimum | 8.0% | 15.4% |
| Maximum | 59.6% | 45.8% |
| Range | 51.6% | 30.4% |
| Mean | 26.5% | 29.9% |
| Median | 25.7% | 29.9% |
| Interquartile 25% (IQ1) | 18.5% | 21.5% |
| Interquartile 75% (IQ3) | 32.7% | 40.1% |
| Interquartile Range (IQR) | 14.3% | 18.7% |
| Standard Deviation (Sample) | 11.3% | 9.3% |
| Standard Deviation (Population) | 11.2% | 9.1% |
Similar Demographics by Associate's Degree
Demographics Similar to Potawatomi by Associate's Degree
In terms of associate's degree, the demographic groups most similar to Potawatomi are Puerto Rican (40.4%, a difference of 0.10%), Immigrants from Dominica (40.5%, a difference of 0.14%), Blackfeet (40.3%, a difference of 0.16%), Puget Sound Salish (40.5%, a difference of 0.28%), and Ottawa (40.3%, a difference of 0.30%).
| Demographics | Rating | Rank | Associate's Degree |
| Central American Indians | 0.2 /100 | #268 | Tragic 40.8% |
| Americans | 0.2 /100 | #269 | Tragic 40.8% |
| Chippewa | 0.2 /100 | #270 | Tragic 40.7% |
| Immigrants | Laos | 0.1 /100 | #271 | Tragic 40.7% |
| Belizeans | 0.1 /100 | #272 | Tragic 40.6% |
| Puget Sound Salish | 0.1 /100 | #273 | Tragic 40.5% |
| Immigrants | Dominica | 0.1 /100 | #274 | Tragic 40.5% |
| Potawatomi | 0.1 /100 | #275 | Tragic 40.4% |
| Puerto Ricans | 0.1 /100 | #276 | Tragic 40.4% |
| Blackfeet | 0.1 /100 | #277 | Tragic 40.3% |
| Ottawa | 0.1 /100 | #278 | Tragic 40.3% |
| Immigrants | Nicaragua | 0.1 /100 | #279 | Tragic 40.3% |
| Immigrants | Micronesia | 0.1 /100 | #280 | Tragic 40.2% |
| Immigrants | Portugal | 0.1 /100 | #281 | Tragic 40.1% |
| Bangladeshis | 0.1 /100 | #282 | Tragic 40.0% |
Demographics Similar to Fijians by Associate's Degree
In terms of associate's degree, the demographic groups most similar to Fijians are Cajun (37.4%, a difference of 0.030%), Immigrants from Yemen (37.3%, a difference of 0.15%), Alaska Native (37.5%, a difference of 0.22%), Pennsylvania German (37.2%, a difference of 0.43%), and Yaqui (37.6%, a difference of 0.45%).
| Demographics | Rating | Rank | Associate's Degree |
| Choctaw | 0.0 /100 | #312 | Tragic 37.8% |
| Hispanics or Latinos | 0.0 /100 | #313 | Tragic 37.7% |
| Seminole | 0.0 /100 | #314 | Tragic 37.7% |
| Creek | 0.0 /100 | #315 | Tragic 37.6% |
| Crow | 0.0 /100 | #316 | Tragic 37.6% |
| Yaqui | 0.0 /100 | #317 | Tragic 37.6% |
| Alaska Natives | 0.0 /100 | #318 | Tragic 37.5% |
| Fijians | 0.0 /100 | #319 | Tragic 37.4% |
| Cajuns | 0.0 /100 | #320 | Tragic 37.4% |
| Immigrants | Yemen | 0.0 /100 | #321 | Tragic 37.3% |
| Pennsylvania Germans | 0.0 /100 | #322 | Tragic 37.2% |
| Immigrants | Cabo Verde | 0.0 /100 | #323 | Tragic 36.8% |
| Arapaho | 0.0 /100 | #324 | Tragic 36.7% |
| Menominee | 0.0 /100 | #325 | Tragic 36.7% |
| Kiowa | 0.0 /100 | #326 | Tragic 36.5% |