Potawatomi vs Cambodian Associate's Degree
COMPARE
Potawatomi
Cambodian
Associate's Degree
Associate's Degree Comparison
Potawatomi
Cambodians
40.4%
ASSOCIATE'S DEGREE
0.1/ 100
METRIC RATING
275th/ 347
METRIC RANK
54.6%
ASSOCIATE'S DEGREE
100.0/ 100
METRIC RATING
20th/ 347
METRIC RANK
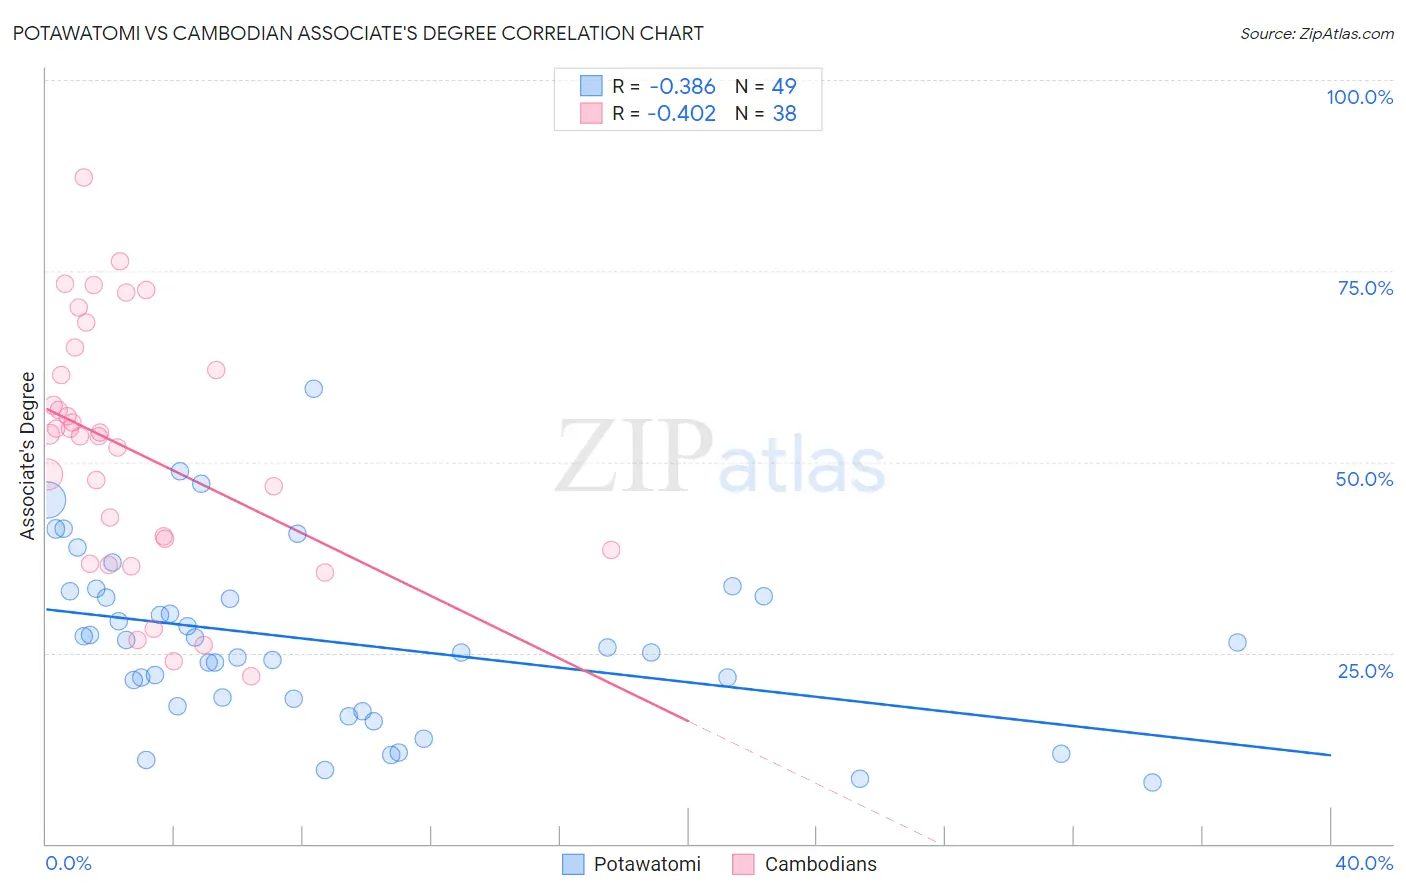
Potawatomi vs Cambodian Associate's Degree Correlation Chart
The statistical analysis conducted on geographies consisting of 117,773,349 people shows a mild negative correlation between the proportion of Potawatomi and percentage of population with at least associate's degree education in the United States with a correlation coefficient (R) of -0.386 and weighted average of 40.4%. Similarly, the statistical analysis conducted on geographies consisting of 102,512,775 people shows a moderate negative correlation between the proportion of Cambodians and percentage of population with at least associate's degree education in the United States with a correlation coefficient (R) of -0.402 and weighted average of 54.6%, a difference of 35.2%.
Associate's Degree Correlation Summary
| Measurement | Potawatomi | Cambodian |
| Minimum | 8.0% | 21.9% |
| Maximum | 59.6% | 87.2% |
| Range | 51.6% | 65.4% |
| Mean | 26.5% | 51.5% |
| Median | 25.7% | 53.5% |
| Interquartile 25% (IQ1) | 18.5% | 38.4% |
| Interquartile 75% (IQ3) | 32.7% | 62.1% |
| Interquartile Range (IQR) | 14.3% | 23.7% |
| Standard Deviation (Sample) | 11.3% | 16.3% |
| Standard Deviation (Population) | 11.2% | 16.1% |
Similar Demographics by Associate's Degree
Demographics Similar to Potawatomi by Associate's Degree
In terms of associate's degree, the demographic groups most similar to Potawatomi are Puerto Rican (40.4%, a difference of 0.10%), Immigrants from Dominica (40.5%, a difference of 0.14%), Blackfeet (40.3%, a difference of 0.16%), Puget Sound Salish (40.5%, a difference of 0.28%), and Ottawa (40.3%, a difference of 0.30%).
| Demographics | Rating | Rank | Associate's Degree |
| Central American Indians | 0.2 /100 | #268 | Tragic 40.8% |
| Americans | 0.2 /100 | #269 | Tragic 40.8% |
| Chippewa | 0.2 /100 | #270 | Tragic 40.7% |
| Immigrants | Laos | 0.1 /100 | #271 | Tragic 40.7% |
| Belizeans | 0.1 /100 | #272 | Tragic 40.6% |
| Puget Sound Salish | 0.1 /100 | #273 | Tragic 40.5% |
| Immigrants | Dominica | 0.1 /100 | #274 | Tragic 40.5% |
| Potawatomi | 0.1 /100 | #275 | Tragic 40.4% |
| Puerto Ricans | 0.1 /100 | #276 | Tragic 40.4% |
| Blackfeet | 0.1 /100 | #277 | Tragic 40.3% |
| Ottawa | 0.1 /100 | #278 | Tragic 40.3% |
| Immigrants | Nicaragua | 0.1 /100 | #279 | Tragic 40.3% |
| Immigrants | Micronesia | 0.1 /100 | #280 | Tragic 40.2% |
| Immigrants | Portugal | 0.1 /100 | #281 | Tragic 40.1% |
| Bangladeshis | 0.1 /100 | #282 | Tragic 40.0% |
Demographics Similar to Cambodians by Associate's Degree
In terms of associate's degree, the demographic groups most similar to Cambodians are Immigrants from Ireland (54.7%, a difference of 0.020%), Immigrants from Sweden (54.6%, a difference of 0.060%), Immigrants from Japan (54.6%, a difference of 0.10%), Burmese (54.6%, a difference of 0.10%), and Immigrants from Korea (54.5%, a difference of 0.19%).
| Demographics | Rating | Rank | Associate's Degree |
| Immigrants | China | 100.0 /100 | #13 | Exceptional 55.5% |
| Immigrants | Hong Kong | 100.0 /100 | #14 | Exceptional 55.4% |
| Immigrants | Eastern Asia | 100.0 /100 | #15 | Exceptional 55.4% |
| Soviet Union | 100.0 /100 | #16 | Exceptional 55.1% |
| Eastern Europeans | 100.0 /100 | #17 | Exceptional 55.0% |
| Indians (Asian) | 100.0 /100 | #18 | Exceptional 54.8% |
| Immigrants | Ireland | 100.0 /100 | #19 | Exceptional 54.7% |
| Cambodians | 100.0 /100 | #20 | Exceptional 54.6% |
| Immigrants | Sweden | 100.0 /100 | #21 | Exceptional 54.6% |
| Immigrants | Japan | 100.0 /100 | #22 | Exceptional 54.6% |
| Burmese | 100.0 /100 | #23 | Exceptional 54.6% |
| Immigrants | Korea | 100.0 /100 | #24 | Exceptional 54.5% |
| Immigrants | Switzerland | 100.0 /100 | #25 | Exceptional 54.5% |
| Immigrants | Belgium | 100.0 /100 | #26 | Exceptional 54.5% |
| Latvians | 100.0 /100 | #27 | Exceptional 53.9% |