Potawatomi vs Italian Associate's Degree
COMPARE
Potawatomi
Italian
Associate's Degree
Associate's Degree Comparison
Potawatomi
Italians
40.4%
ASSOCIATE'S DEGREE
0.1/ 100
METRIC RATING
275th/ 347
METRIC RANK
48.7%
ASSOCIATE'S DEGREE
93.9/ 100
METRIC RATING
122nd/ 347
METRIC RANK
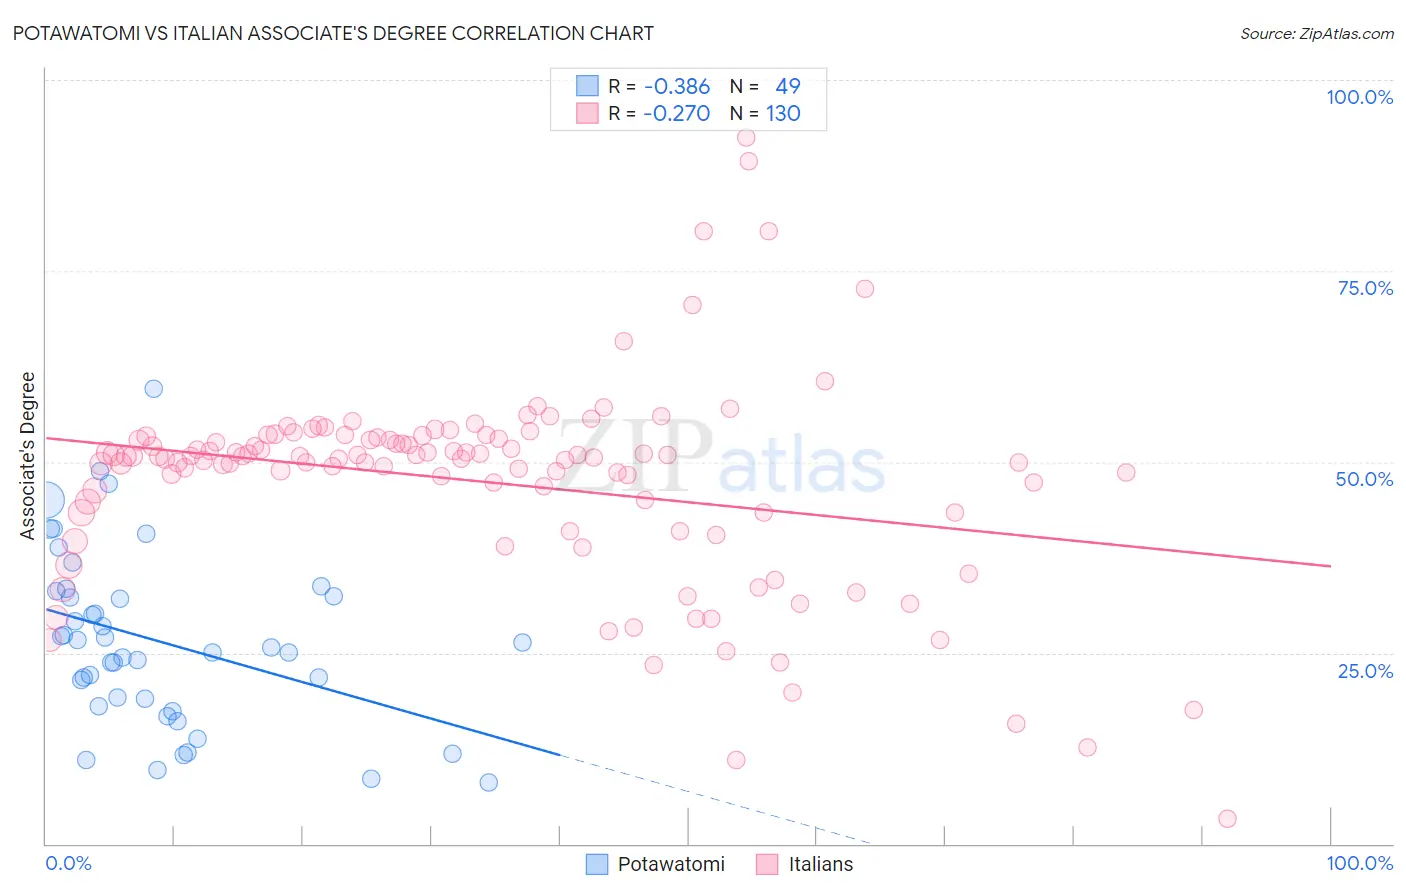
Potawatomi vs Italian Associate's Degree Correlation Chart
The statistical analysis conducted on geographies consisting of 117,773,349 people shows a mild negative correlation between the proportion of Potawatomi and percentage of population with at least associate's degree education in the United States with a correlation coefficient (R) of -0.386 and weighted average of 40.4%. Similarly, the statistical analysis conducted on geographies consisting of 575,016,726 people shows a weak negative correlation between the proportion of Italians and percentage of population with at least associate's degree education in the United States with a correlation coefficient (R) of -0.270 and weighted average of 48.7%, a difference of 20.6%.
Associate's Degree Correlation Summary
| Measurement | Potawatomi | Italian |
| Minimum | 8.0% | 3.2% |
| Maximum | 59.6% | 92.5% |
| Range | 51.6% | 89.3% |
| Mean | 26.5% | 47.4% |
| Median | 25.7% | 50.6% |
| Interquartile 25% (IQ1) | 18.5% | 43.4% |
| Interquartile 75% (IQ3) | 32.7% | 53.1% |
| Interquartile Range (IQR) | 14.3% | 9.7% |
| Standard Deviation (Sample) | 11.3% | 13.4% |
| Standard Deviation (Population) | 11.2% | 13.4% |
Similar Demographics by Associate's Degree
Demographics Similar to Potawatomi by Associate's Degree
In terms of associate's degree, the demographic groups most similar to Potawatomi are Puerto Rican (40.4%, a difference of 0.10%), Immigrants from Dominica (40.5%, a difference of 0.14%), Blackfeet (40.3%, a difference of 0.16%), Puget Sound Salish (40.5%, a difference of 0.28%), and Ottawa (40.3%, a difference of 0.30%).
| Demographics | Rating | Rank | Associate's Degree |
| Central American Indians | 0.2 /100 | #268 | Tragic 40.8% |
| Americans | 0.2 /100 | #269 | Tragic 40.8% |
| Chippewa | 0.2 /100 | #270 | Tragic 40.7% |
| Immigrants | Laos | 0.1 /100 | #271 | Tragic 40.7% |
| Belizeans | 0.1 /100 | #272 | Tragic 40.6% |
| Puget Sound Salish | 0.1 /100 | #273 | Tragic 40.5% |
| Immigrants | Dominica | 0.1 /100 | #274 | Tragic 40.5% |
| Potawatomi | 0.1 /100 | #275 | Tragic 40.4% |
| Puerto Ricans | 0.1 /100 | #276 | Tragic 40.4% |
| Blackfeet | 0.1 /100 | #277 | Tragic 40.3% |
| Ottawa | 0.1 /100 | #278 | Tragic 40.3% |
| Immigrants | Nicaragua | 0.1 /100 | #279 | Tragic 40.3% |
| Immigrants | Micronesia | 0.1 /100 | #280 | Tragic 40.2% |
| Immigrants | Portugal | 0.1 /100 | #281 | Tragic 40.1% |
| Bangladeshis | 0.1 /100 | #282 | Tragic 40.0% |
Demographics Similar to Italians by Associate's Degree
In terms of associate's degree, the demographic groups most similar to Italians are Ugandan (48.7%, a difference of 0.0%), Brazilian (48.7%, a difference of 0.060%), Alsatian (48.8%, a difference of 0.23%), Lebanese (48.8%, a difference of 0.25%), and Albanian (48.8%, a difference of 0.26%).
| Demographics | Rating | Rank | Associate's Degree |
| Luxembourgers | 95.1 /100 | #115 | Exceptional 48.9% |
| British | 95.0 /100 | #116 | Exceptional 48.9% |
| Afghans | 94.8 /100 | #117 | Exceptional 48.9% |
| Albanians | 94.7 /100 | #118 | Exceptional 48.8% |
| Lebanese | 94.6 /100 | #119 | Exceptional 48.8% |
| Alsatians | 94.6 /100 | #120 | Exceptional 48.8% |
| Ugandans | 93.9 /100 | #121 | Exceptional 48.7% |
| Italians | 93.9 /100 | #122 | Exceptional 48.7% |
| Brazilians | 93.7 /100 | #123 | Exceptional 48.7% |
| Serbians | 92.6 /100 | #124 | Exceptional 48.5% |
| Chinese | 92.5 /100 | #125 | Exceptional 48.5% |
| Immigrants | Syria | 92.2 /100 | #126 | Exceptional 48.5% |
| Immigrants | Uganda | 92.1 /100 | #127 | Exceptional 48.5% |
| Immigrants | Eastern Africa | 91.6 /100 | #128 | Exceptional 48.4% |
| Swedes | 91.5 /100 | #129 | Exceptional 48.4% |