Polish vs Immigrants from Fiji Bachelor's Degree
COMPARE
Polish
Immigrants from Fiji
Bachelor's Degree
Bachelor's Degree Comparison
Poles
Immigrants from Fiji
39.1%
BACHELOR'S DEGREE
79.8/ 100
METRIC RATING
143rd/ 347
METRIC RANK
33.7%
BACHELOR'S DEGREE
1.2/ 100
METRIC RATING
245th/ 347
METRIC RANK
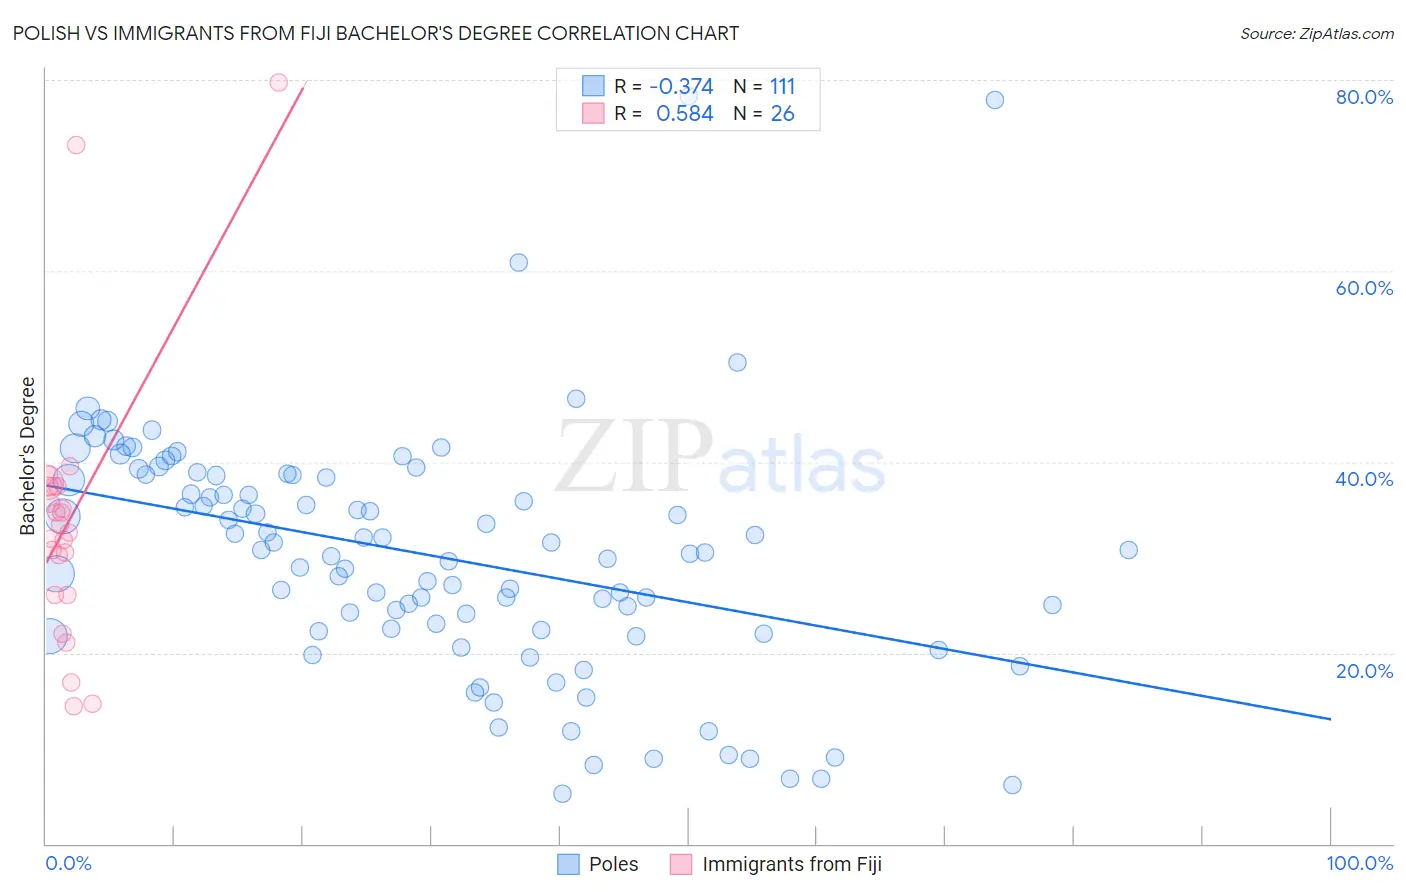
Polish vs Immigrants from Fiji Bachelor's Degree Correlation Chart
The statistical analysis conducted on geographies consisting of 560,456,135 people shows a mild negative correlation between the proportion of Poles and percentage of population with at least bachelor's degree education in the United States with a correlation coefficient (R) of -0.374 and weighted average of 39.1%. Similarly, the statistical analysis conducted on geographies consisting of 93,755,724 people shows a substantial positive correlation between the proportion of Immigrants from Fiji and percentage of population with at least bachelor's degree education in the United States with a correlation coefficient (R) of 0.584 and weighted average of 33.7%, a difference of 15.9%.
Bachelor's Degree Correlation Summary
| Measurement | Polish | Immigrants from Fiji |
| Minimum | 5.2% | 14.4% |
| Maximum | 78.3% | 79.8% |
| Range | 73.0% | 65.4% |
| Mean | 30.3% | 34.0% |
| Median | 30.7% | 33.0% |
| Interquartile 25% (IQ1) | 22.4% | 26.1% |
| Interquartile 75% (IQ3) | 38.7% | 37.5% |
| Interquartile Range (IQR) | 16.3% | 11.4% |
| Standard Deviation (Sample) | 12.7% | 14.5% |
| Standard Deviation (Population) | 12.7% | 14.3% |
Similar Demographics by Bachelor's Degree
Demographics Similar to Poles by Bachelor's Degree
In terms of bachelor's degree, the demographic groups most similar to Poles are Immigrants from Afghanistan (39.1%, a difference of 0.020%), Slovene (39.1%, a difference of 0.050%), Swedish (39.1%, a difference of 0.090%), Immigrants from Sierra Leone (39.0%, a difference of 0.12%), and Iraqi (39.0%, a difference of 0.25%).
| Demographics | Rating | Rank | Bachelor's Degree |
| Pakistanis | 88.2 /100 | #136 | Excellent 39.7% |
| Icelanders | 86.5 /100 | #137 | Excellent 39.5% |
| Europeans | 85.6 /100 | #138 | Excellent 39.5% |
| Immigrants | Sudan | 84.5 /100 | #139 | Excellent 39.4% |
| Immigrants | Armenia | 84.1 /100 | #140 | Excellent 39.4% |
| South American Indians | 83.6 /100 | #141 | Excellent 39.3% |
| Immigrants | North Macedonia | 81.6 /100 | #142 | Excellent 39.2% |
| Poles | 79.8 /100 | #143 | Good 39.1% |
| Immigrants | Afghanistan | 79.7 /100 | #144 | Good 39.1% |
| Slovenes | 79.5 /100 | #145 | Good 39.1% |
| Swedes | 79.2 /100 | #146 | Good 39.1% |
| Immigrants | Sierra Leone | 79.0 /100 | #147 | Good 39.0% |
| Iraqis | 78.1 /100 | #148 | Good 39.0% |
| Immigrants | Poland | 77.5 /100 | #149 | Good 39.0% |
| South Americans | 77.3 /100 | #150 | Good 38.9% |
Demographics Similar to Immigrants from Fiji by Bachelor's Degree
In terms of bachelor's degree, the demographic groups most similar to Immigrants from Fiji are Delaware (33.8%, a difference of 0.090%), Jamaican (33.6%, a difference of 0.36%), Immigrants from Congo (33.6%, a difference of 0.45%), Cree (33.6%, a difference of 0.47%), and Immigrants from Guyana (33.9%, a difference of 0.59%).
| Demographics | Rating | Rank | Bachelor's Degree |
| Guyanese | 2.5 /100 | #238 | Tragic 34.5% |
| British West Indians | 2.5 /100 | #239 | Tragic 34.5% |
| Tongans | 2.0 /100 | #240 | Tragic 34.3% |
| Immigrants | Cambodia | 1.9 /100 | #241 | Tragic 34.2% |
| Immigrants | Nonimmigrants | 1.8 /100 | #242 | Tragic 34.2% |
| Immigrants | Guyana | 1.4 /100 | #243 | Tragic 33.9% |
| Delaware | 1.2 /100 | #244 | Tragic 33.8% |
| Immigrants | Fiji | 1.2 /100 | #245 | Tragic 33.7% |
| Jamaicans | 1.0 /100 | #246 | Tragic 33.6% |
| Immigrants | Congo | 1.0 /100 | #247 | Tragic 33.6% |
| Cree | 1.0 /100 | #248 | Tragic 33.6% |
| Immigrants | Liberia | 0.9 /100 | #249 | Tragic 33.5% |
| Indonesians | 0.9 /100 | #250 | Tragic 33.5% |
| Japanese | 0.7 /100 | #251 | Tragic 33.3% |
| Immigrants | Bahamas | 0.7 /100 | #252 | Tragic 33.3% |