Kenyan vs Immigrants from Ecuador Bachelor's Degree
COMPARE
Kenyan
Immigrants from Ecuador
Bachelor's Degree
Bachelor's Degree Comparison
Kenyans
Immigrants from Ecuador
38.7%
BACHELOR'S DEGREE
72.5/ 100
METRIC RATING
156th/ 347
METRIC RANK
34.7%
BACHELOR'S DEGREE
3.3/ 100
METRIC RATING
233rd/ 347
METRIC RANK
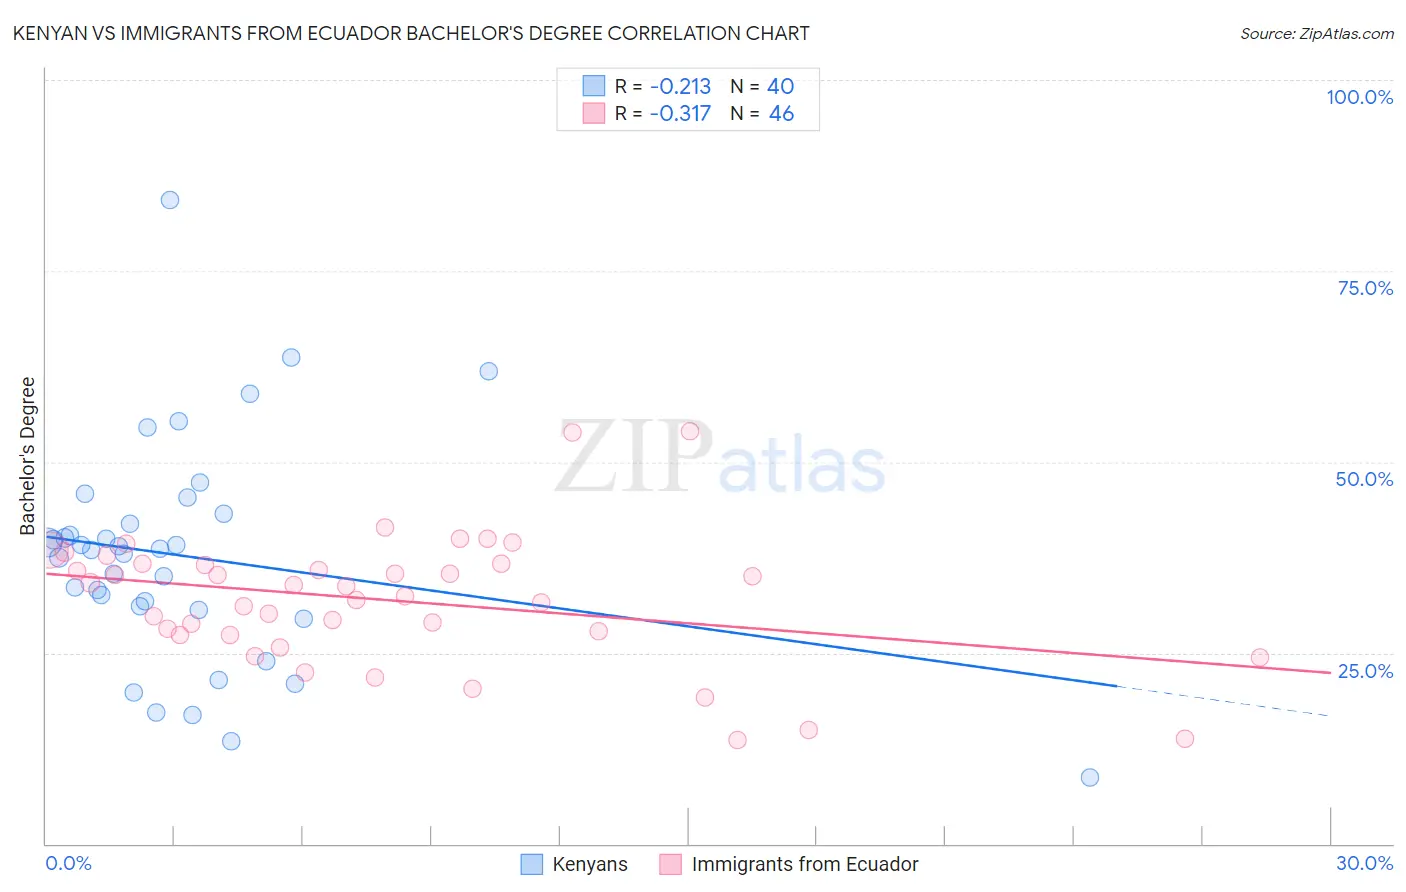
Kenyan vs Immigrants from Ecuador Bachelor's Degree Correlation Chart
The statistical analysis conducted on geographies consisting of 168,237,785 people shows a weak negative correlation between the proportion of Kenyans and percentage of population with at least bachelor's degree education in the United States with a correlation coefficient (R) of -0.213 and weighted average of 38.7%. Similarly, the statistical analysis conducted on geographies consisting of 271,013,109 people shows a mild negative correlation between the proportion of Immigrants from Ecuador and percentage of population with at least bachelor's degree education in the United States with a correlation coefficient (R) of -0.317 and weighted average of 34.7%, a difference of 11.5%.
Bachelor's Degree Correlation Summary
| Measurement | Kenyan | Immigrants from Ecuador |
| Minimum | 8.7% | 13.7% |
| Maximum | 84.3% | 54.0% |
| Range | 75.6% | 40.4% |
| Mean | 37.6% | 31.9% |
| Median | 38.6% | 33.1% |
| Interquartile 25% (IQ1) | 30.8% | 27.4% |
| Interquartile 75% (IQ3) | 42.5% | 36.6% |
| Interquartile Range (IQR) | 11.7% | 9.3% |
| Standard Deviation (Sample) | 14.7% | 8.5% |
| Standard Deviation (Population) | 14.5% | 8.4% |
Similar Demographics by Bachelor's Degree
Demographics Similar to Kenyans by Bachelor's Degree
In terms of bachelor's degree, the demographic groups most similar to Kenyans are Immigrants from Kenya (38.8%, a difference of 0.15%), Immigrants from South America (38.6%, a difference of 0.28%), Canadian (38.8%, a difference of 0.31%), Immigrants from Germany (38.6%, a difference of 0.34%), and Slavic (38.9%, a difference of 0.42%).
| Demographics | Rating | Rank | Bachelor's Degree |
| Immigrants | Poland | 77.5 /100 | #149 | Good 39.0% |
| South Americans | 77.3 /100 | #150 | Good 38.9% |
| Immigrants | Africa | 76.5 /100 | #151 | Good 38.9% |
| Sudanese | 76.4 /100 | #152 | Good 38.9% |
| Slavs | 75.9 /100 | #153 | Good 38.9% |
| Canadians | 75.0 /100 | #154 | Good 38.8% |
| Immigrants | Kenya | 73.8 /100 | #155 | Good 38.8% |
| Kenyans | 72.5 /100 | #156 | Good 38.7% |
| Immigrants | South America | 70.1 /100 | #157 | Good 38.6% |
| Immigrants | Germany | 69.6 /100 | #158 | Good 38.6% |
| Chinese | 66.6 /100 | #159 | Good 38.5% |
| Vietnamese | 66.6 /100 | #160 | Good 38.5% |
| Uruguayans | 65.8 /100 | #161 | Good 38.4% |
| Colombians | 65.0 /100 | #162 | Good 38.4% |
| Peruvians | 63.4 /100 | #163 | Good 38.3% |
Demographics Similar to Immigrants from Ecuador by Bachelor's Degree
In terms of bachelor's degree, the demographic groups most similar to Immigrants from Ecuador are Hmong (34.8%, a difference of 0.11%), Guamanian/Chamorro (34.6%, a difference of 0.22%), Immigrants from West Indies (34.6%, a difference of 0.31%), Liberian (34.6%, a difference of 0.42%), and Tlingit-Haida (34.6%, a difference of 0.45%).
| Demographics | Rating | Rank | Bachelor's Degree |
| Portuguese | 7.2 /100 | #226 | Tragic 35.5% |
| Ecuadorians | 6.6 /100 | #227 | Tragic 35.4% |
| Immigrants | Trinidad and Tobago | 6.0 /100 | #228 | Tragic 35.3% |
| Whites/Caucasians | 5.9 /100 | #229 | Tragic 35.3% |
| Immigrants | Grenada | 4.3 /100 | #230 | Tragic 35.0% |
| Immigrants | St. Vincent and the Grenadines | 4.3 /100 | #231 | Tragic 35.0% |
| Hmong | 3.4 /100 | #232 | Tragic 34.8% |
| Immigrants | Ecuador | 3.3 /100 | #233 | Tragic 34.7% |
| Guamanians/Chamorros | 3.0 /100 | #234 | Tragic 34.6% |
| Immigrants | West Indies | 2.9 /100 | #235 | Tragic 34.6% |
| Liberians | 2.8 /100 | #236 | Tragic 34.6% |
| Tlingit-Haida | 2.8 /100 | #237 | Tragic 34.6% |
| Guyanese | 2.5 /100 | #238 | Tragic 34.5% |
| British West Indians | 2.5 /100 | #239 | Tragic 34.5% |
| Tongans | 2.0 /100 | #240 | Tragic 34.3% |