Latvian vs Immigrants from Ecuador Bachelor's Degree
COMPARE
Latvian
Immigrants from Ecuador
Bachelor's Degree
Bachelor's Degree Comparison
Latvians
Immigrants from Ecuador
46.1%
BACHELOR'S DEGREE
100.0/ 100
METRIC RATING
31st/ 347
METRIC RANK
34.7%
BACHELOR'S DEGREE
3.3/ 100
METRIC RATING
233rd/ 347
METRIC RANK
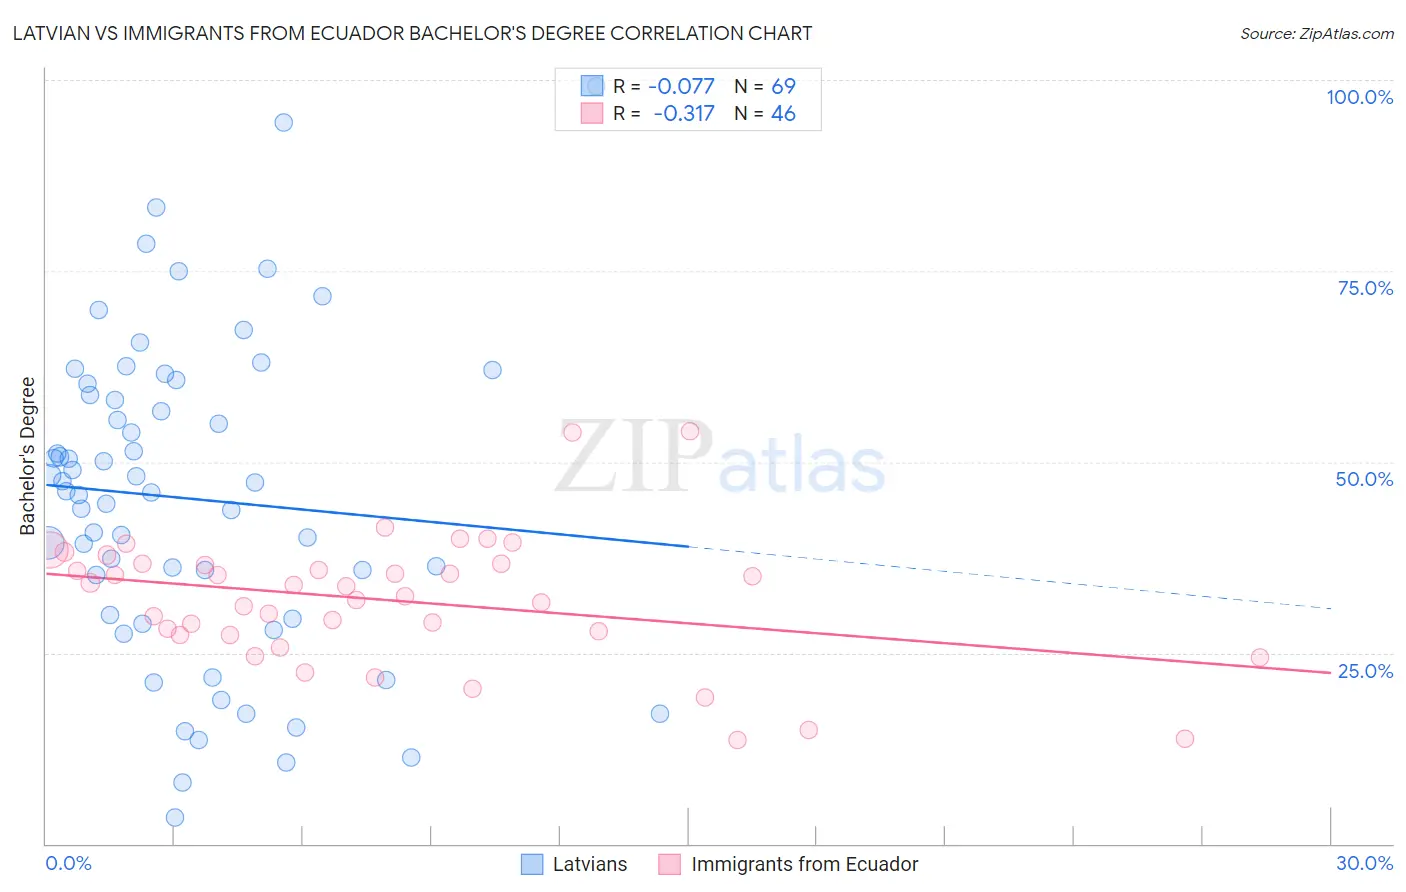
Latvian vs Immigrants from Ecuador Bachelor's Degree Correlation Chart
The statistical analysis conducted on geographies consisting of 220,722,660 people shows a slight negative correlation between the proportion of Latvians and percentage of population with at least bachelor's degree education in the United States with a correlation coefficient (R) of -0.077 and weighted average of 46.1%. Similarly, the statistical analysis conducted on geographies consisting of 271,013,109 people shows a mild negative correlation between the proportion of Immigrants from Ecuador and percentage of population with at least bachelor's degree education in the United States with a correlation coefficient (R) of -0.317 and weighted average of 34.7%, a difference of 32.8%.
Bachelor's Degree Correlation Summary
| Measurement | Latvian | Immigrants from Ecuador |
| Minimum | 3.4% | 13.7% |
| Maximum | 99.2% | 54.0% |
| Range | 95.8% | 40.4% |
| Mean | 45.2% | 31.9% |
| Median | 46.1% | 33.1% |
| Interquartile 25% (IQ1) | 29.7% | 27.4% |
| Interquartile 75% (IQ3) | 59.5% | 36.6% |
| Interquartile Range (IQR) | 29.8% | 9.3% |
| Standard Deviation (Sample) | 20.7% | 8.5% |
| Standard Deviation (Population) | 20.5% | 8.4% |
Similar Demographics by Bachelor's Degree
Demographics Similar to Latvians by Bachelor's Degree
In terms of bachelor's degree, the demographic groups most similar to Latvians are Immigrants from Sri Lanka (46.1%, a difference of 0.040%), Israeli (46.1%, a difference of 0.090%), Turkish (46.2%, a difference of 0.22%), Immigrants from Turkey (46.0%, a difference of 0.30%), and Immigrants from France (46.4%, a difference of 0.68%).
| Demographics | Rating | Rank | Bachelor's Degree |
| Immigrants | Korea | 100.0 /100 | #24 | Exceptional 47.0% |
| Burmese | 100.0 /100 | #25 | Exceptional 46.9% |
| Immigrants | Japan | 100.0 /100 | #26 | Exceptional 46.8% |
| Immigrants | France | 100.0 /100 | #27 | Exceptional 46.4% |
| Turks | 100.0 /100 | #28 | Exceptional 46.2% |
| Israelis | 100.0 /100 | #29 | Exceptional 46.1% |
| Immigrants | Sri Lanka | 100.0 /100 | #30 | Exceptional 46.1% |
| Latvians | 100.0 /100 | #31 | Exceptional 46.1% |
| Immigrants | Turkey | 100.0 /100 | #32 | Exceptional 46.0% |
| Immigrants | Northern Europe | 100.0 /100 | #33 | Exceptional 45.6% |
| Immigrants | Denmark | 100.0 /100 | #34 | Exceptional 45.4% |
| Immigrants | Russia | 100.0 /100 | #35 | Exceptional 45.4% |
| Mongolians | 100.0 /100 | #36 | Exceptional 45.4% |
| Russians | 100.0 /100 | #37 | Exceptional 45.3% |
| Bulgarians | 100.0 /100 | #38 | Exceptional 45.3% |
Demographics Similar to Immigrants from Ecuador by Bachelor's Degree
In terms of bachelor's degree, the demographic groups most similar to Immigrants from Ecuador are Hmong (34.8%, a difference of 0.11%), Guamanian/Chamorro (34.6%, a difference of 0.22%), Immigrants from West Indies (34.6%, a difference of 0.31%), Liberian (34.6%, a difference of 0.42%), and Tlingit-Haida (34.6%, a difference of 0.45%).
| Demographics | Rating | Rank | Bachelor's Degree |
| Portuguese | 7.2 /100 | #226 | Tragic 35.5% |
| Ecuadorians | 6.6 /100 | #227 | Tragic 35.4% |
| Immigrants | Trinidad and Tobago | 6.0 /100 | #228 | Tragic 35.3% |
| Whites/Caucasians | 5.9 /100 | #229 | Tragic 35.3% |
| Immigrants | Grenada | 4.3 /100 | #230 | Tragic 35.0% |
| Immigrants | St. Vincent and the Grenadines | 4.3 /100 | #231 | Tragic 35.0% |
| Hmong | 3.4 /100 | #232 | Tragic 34.8% |
| Immigrants | Ecuador | 3.3 /100 | #233 | Tragic 34.7% |
| Guamanians/Chamorros | 3.0 /100 | #234 | Tragic 34.6% |
| Immigrants | West Indies | 2.9 /100 | #235 | Tragic 34.6% |
| Liberians | 2.8 /100 | #236 | Tragic 34.6% |
| Tlingit-Haida | 2.8 /100 | #237 | Tragic 34.6% |
| Guyanese | 2.5 /100 | #238 | Tragic 34.5% |
| British West Indians | 2.5 /100 | #239 | Tragic 34.5% |
| Tongans | 2.0 /100 | #240 | Tragic 34.3% |