U.S. Virgin Islander vs Immigrants from Ecuador Bachelor's Degree
COMPARE
U.S. Virgin Islander
Immigrants from Ecuador
Bachelor's Degree
Bachelor's Degree Comparison
U.S. Virgin Islanders
Immigrants from Ecuador
33.2%
BACHELOR'S DEGREE
0.7/ 100
METRIC RATING
253rd/ 347
METRIC RANK
34.7%
BACHELOR'S DEGREE
3.3/ 100
METRIC RATING
233rd/ 347
METRIC RANK
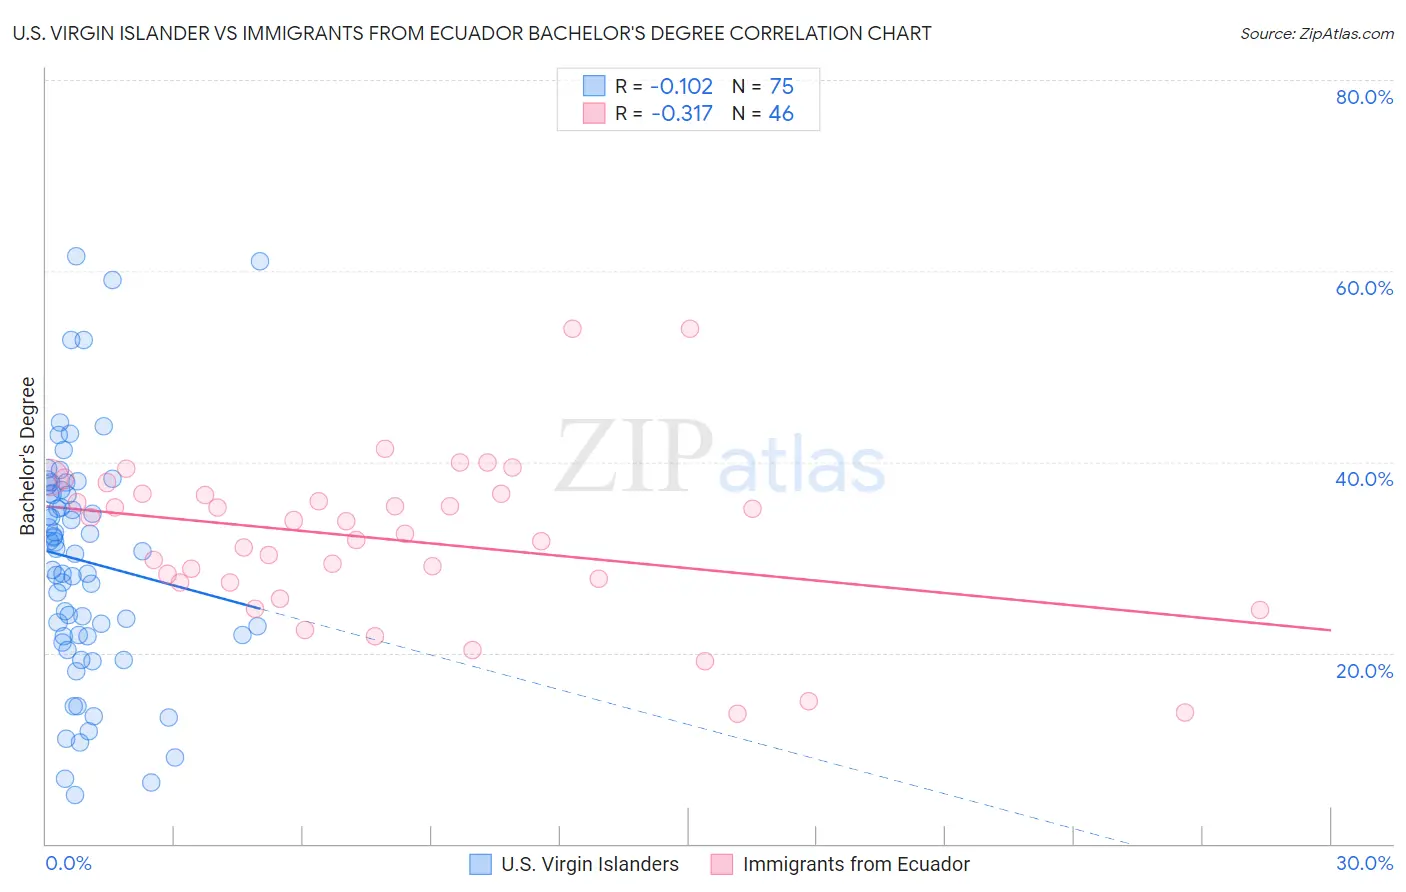
U.S. Virgin Islander vs Immigrants from Ecuador Bachelor's Degree Correlation Chart
The statistical analysis conducted on geographies consisting of 87,527,119 people shows a poor negative correlation between the proportion of U.S. Virgin Islanders and percentage of population with at least bachelor's degree education in the United States with a correlation coefficient (R) of -0.102 and weighted average of 33.2%. Similarly, the statistical analysis conducted on geographies consisting of 271,013,109 people shows a mild negative correlation between the proportion of Immigrants from Ecuador and percentage of population with at least bachelor's degree education in the United States with a correlation coefficient (R) of -0.317 and weighted average of 34.7%, a difference of 4.4%.
Bachelor's Degree Correlation Summary
| Measurement | U.S. Virgin Islander | Immigrants from Ecuador |
| Minimum | 5.1% | 13.7% |
| Maximum | 61.5% | 54.0% |
| Range | 56.4% | 40.4% |
| Mean | 29.6% | 31.9% |
| Median | 30.7% | 33.1% |
| Interquartile 25% (IQ1) | 21.7% | 27.4% |
| Interquartile 75% (IQ3) | 37.1% | 36.6% |
| Interquartile Range (IQR) | 15.4% | 9.3% |
| Standard Deviation (Sample) | 12.3% | 8.5% |
| Standard Deviation (Population) | 12.2% | 8.4% |
Demographics Similar to U.S. Virgin Islanders and Immigrants from Ecuador by Bachelor's Degree
In terms of bachelor's degree, the demographic groups most similar to U.S. Virgin Islanders are Immigrants from Bahamas (33.3%, a difference of 0.21%), Japanese (33.3%, a difference of 0.28%), Indonesian (33.5%, a difference of 0.91%), Immigrants from Liberia (33.5%, a difference of 0.92%), and Cree (33.6%, a difference of 1.1%). Similarly, the demographic groups most similar to Immigrants from Ecuador are Guamanian/Chamorro (34.6%, a difference of 0.22%), Immigrants from West Indies (34.6%, a difference of 0.31%), Liberian (34.6%, a difference of 0.42%), Tlingit-Haida (34.6%, a difference of 0.45%), and Guyanese (34.5%, a difference of 0.74%).
| Demographics | Rating | Rank | Bachelor's Degree |
| Immigrants | Ecuador | 3.3 /100 | #233 | Tragic 34.7% |
| Guamanians/Chamorros | 3.0 /100 | #234 | Tragic 34.6% |
| Immigrants | West Indies | 2.9 /100 | #235 | Tragic 34.6% |
| Liberians | 2.8 /100 | #236 | Tragic 34.6% |
| Tlingit-Haida | 2.8 /100 | #237 | Tragic 34.6% |
| Guyanese | 2.5 /100 | #238 | Tragic 34.5% |
| British West Indians | 2.5 /100 | #239 | Tragic 34.5% |
| Tongans | 2.0 /100 | #240 | Tragic 34.3% |
| Immigrants | Cambodia | 1.9 /100 | #241 | Tragic 34.2% |
| Immigrants | Nonimmigrants | 1.8 /100 | #242 | Tragic 34.2% |
| Immigrants | Guyana | 1.4 /100 | #243 | Tragic 33.9% |
| Delaware | 1.2 /100 | #244 | Tragic 33.8% |
| Immigrants | Fiji | 1.2 /100 | #245 | Tragic 33.7% |
| Jamaicans | 1.0 /100 | #246 | Tragic 33.6% |
| Immigrants | Congo | 1.0 /100 | #247 | Tragic 33.6% |
| Cree | 1.0 /100 | #248 | Tragic 33.6% |
| Immigrants | Liberia | 0.9 /100 | #249 | Tragic 33.5% |
| Indonesians | 0.9 /100 | #250 | Tragic 33.5% |
| Japanese | 0.7 /100 | #251 | Tragic 33.3% |
| Immigrants | Bahamas | 0.7 /100 | #252 | Tragic 33.3% |
| U.S. Virgin Islanders | 0.7 /100 | #253 | Tragic 33.2% |