Peruvian vs Immigrants from Zimbabwe No Schooling Completed
COMPARE
Peruvian
Immigrants from Zimbabwe
No Schooling Completed
No Schooling Completed Comparison
Peruvians
Immigrants from Zimbabwe
2.4%
NO SCHOOLING COMPLETED
1.4/ 100
METRIC RATING
244th/ 347
METRIC RANK
1.9%
NO SCHOOLING COMPLETED
96.2/ 100
METRIC RATING
113th/ 347
METRIC RANK
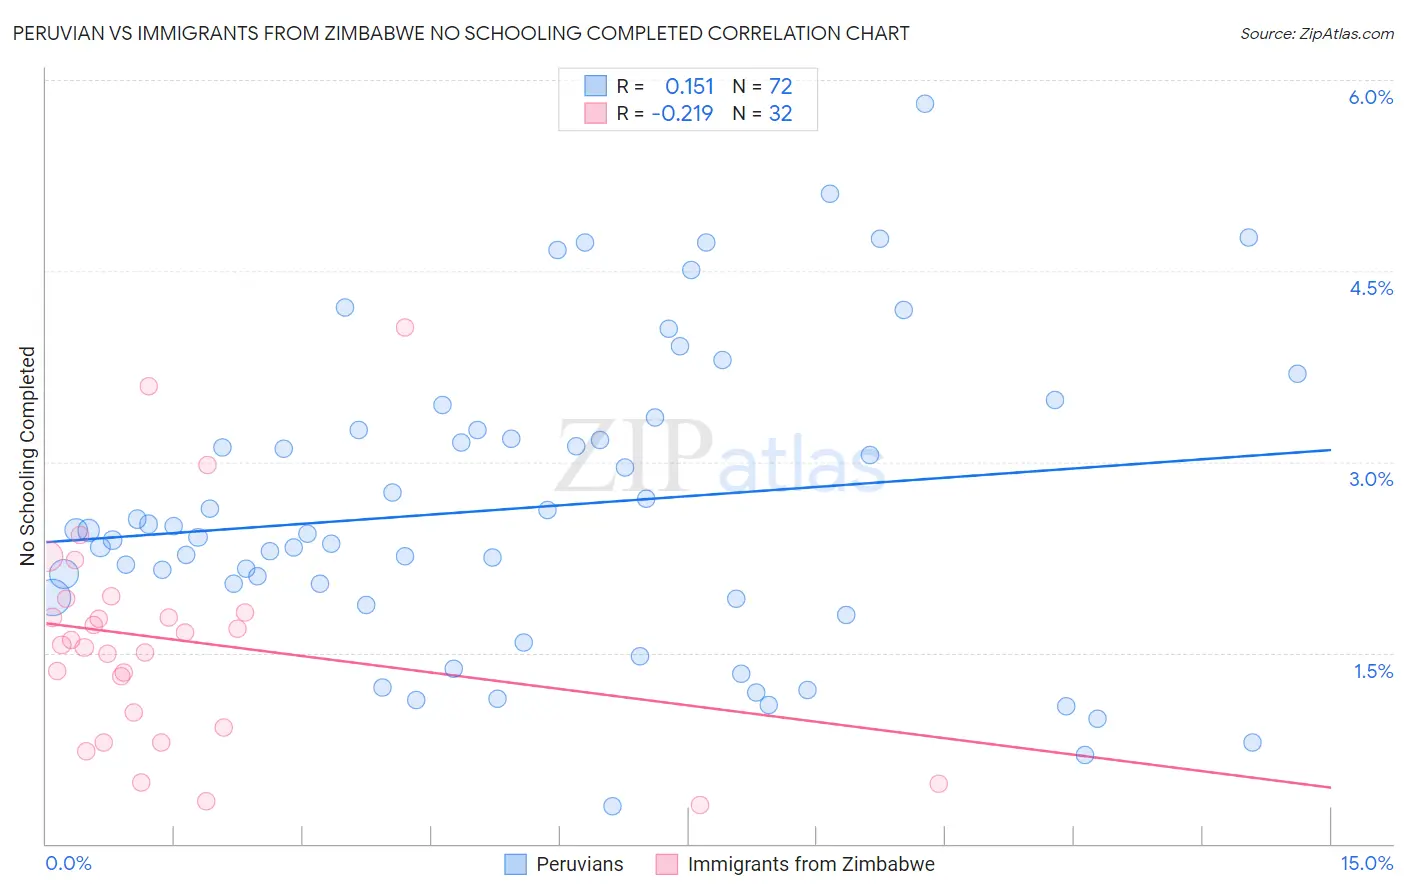
Peruvian vs Immigrants from Zimbabwe No Schooling Completed Correlation Chart
The statistical analysis conducted on geographies consisting of 360,290,291 people shows a poor positive correlation between the proportion of Peruvians and percentage of population with no schooling in the United States with a correlation coefficient (R) of 0.151 and weighted average of 2.4%. Similarly, the statistical analysis conducted on geographies consisting of 117,317,666 people shows a weak negative correlation between the proportion of Immigrants from Zimbabwe and percentage of population with no schooling in the United States with a correlation coefficient (R) of -0.219 and weighted average of 1.9%, a difference of 28.1%.
No Schooling Completed Correlation Summary
| Measurement | Peruvian | Immigrants from Zimbabwe |
| Minimum | 0.29% | 0.31% |
| Maximum | 5.8% | 4.1% |
| Range | 5.5% | 3.8% |
| Mean | 2.6% | 1.6% |
| Median | 2.4% | 1.6% |
| Interquartile 25% (IQ1) | 1.9% | 0.97% |
| Interquartile 75% (IQ3) | 3.2% | 1.9% |
| Interquartile Range (IQR) | 1.3% | 0.90% |
| Standard Deviation (Sample) | 1.2% | 0.86% |
| Standard Deviation (Population) | 1.2% | 0.84% |
Similar Demographics by No Schooling Completed
Demographics Similar to Peruvians by No Schooling Completed
In terms of no schooling completed, the demographic groups most similar to Peruvians are Bolivian (2.4%, a difference of 0.010%), Immigrants from Congo (2.4%, a difference of 0.050%), South American (2.4%, a difference of 0.11%), Immigrants from Indonesia (2.4%, a difference of 0.14%), and Immigrants from Iraq (2.4%, a difference of 0.16%).
| Demographics | Rating | Rank | No Schooling Completed |
| Immigrants | Eastern Asia | 2.0 /100 | #237 | Tragic 2.4% |
| Paiute | 1.9 /100 | #238 | Tragic 2.4% |
| Liberians | 1.8 /100 | #239 | Tragic 2.4% |
| Immigrants | Senegal | 1.7 /100 | #240 | Tragic 2.4% |
| Koreans | 1.7 /100 | #241 | Tragic 2.4% |
| Immigrants | Indonesia | 1.5 /100 | #242 | Tragic 2.4% |
| South Americans | 1.5 /100 | #243 | Tragic 2.4% |
| Peruvians | 1.4 /100 | #244 | Tragic 2.4% |
| Bolivians | 1.4 /100 | #245 | Tragic 2.4% |
| Immigrants | Congo | 1.4 /100 | #246 | Tragic 2.4% |
| Immigrants | Iraq | 1.3 /100 | #247 | Tragic 2.4% |
| Asians | 1.2 /100 | #248 | Tragic 2.4% |
| Jamaicans | 1.2 /100 | #249 | Tragic 2.4% |
| Immigrants | Middle Africa | 1.1 /100 | #250 | Tragic 2.4% |
| Immigrants | Africa | 1.1 /100 | #251 | Tragic 2.4% |
Demographics Similar to Immigrants from Zimbabwe by No Schooling Completed
In terms of no schooling completed, the demographic groups most similar to Immigrants from Zimbabwe are Immigrants from Norway (1.9%, a difference of 0.010%), Syrian (1.9%, a difference of 0.14%), Lebanese (1.9%, a difference of 0.16%), Pueblo (1.9%, a difference of 0.25%), and Immigrants from Serbia (1.9%, a difference of 0.36%).
| Demographics | Rating | Rank | No Schooling Completed |
| Immigrants | France | 97.3 /100 | #106 | Exceptional 1.8% |
| Yugoslavians | 97.2 /100 | #107 | Exceptional 1.8% |
| Okinawans | 97.1 /100 | #108 | Exceptional 1.8% |
| Immigrants | Saudi Arabia | 96.8 /100 | #109 | Exceptional 1.9% |
| Immigrants | Latvia | 96.7 /100 | #110 | Exceptional 1.9% |
| Immigrants | Japan | 96.6 /100 | #111 | Exceptional 1.9% |
| Pueblo | 96.4 /100 | #112 | Exceptional 1.9% |
| Immigrants | Zimbabwe | 96.2 /100 | #113 | Exceptional 1.9% |
| Immigrants | Norway | 96.1 /100 | #114 | Exceptional 1.9% |
| Syrians | 96.0 /100 | #115 | Exceptional 1.9% |
| Lebanese | 96.0 /100 | #116 | Exceptional 1.9% |
| Immigrants | Serbia | 95.8 /100 | #117 | Exceptional 1.9% |
| Spanish | 95.5 /100 | #118 | Exceptional 1.9% |
| Iroquois | 95.1 /100 | #119 | Exceptional 1.9% |
| Immigrants | Bulgaria | 94.6 /100 | #120 | Exceptional 1.9% |