Peruvian vs Immigrants from Western Europe No Schooling Completed
COMPARE
Peruvian
Immigrants from Western Europe
No Schooling Completed
No Schooling Completed Comparison
Peruvians
Immigrants from Western Europe
2.4%
NO SCHOOLING COMPLETED
1.4/ 100
METRIC RATING
244th/ 347
METRIC RANK
1.8%
NO SCHOOLING COMPLETED
99.2/ 100
METRIC RATING
88th/ 347
METRIC RANK
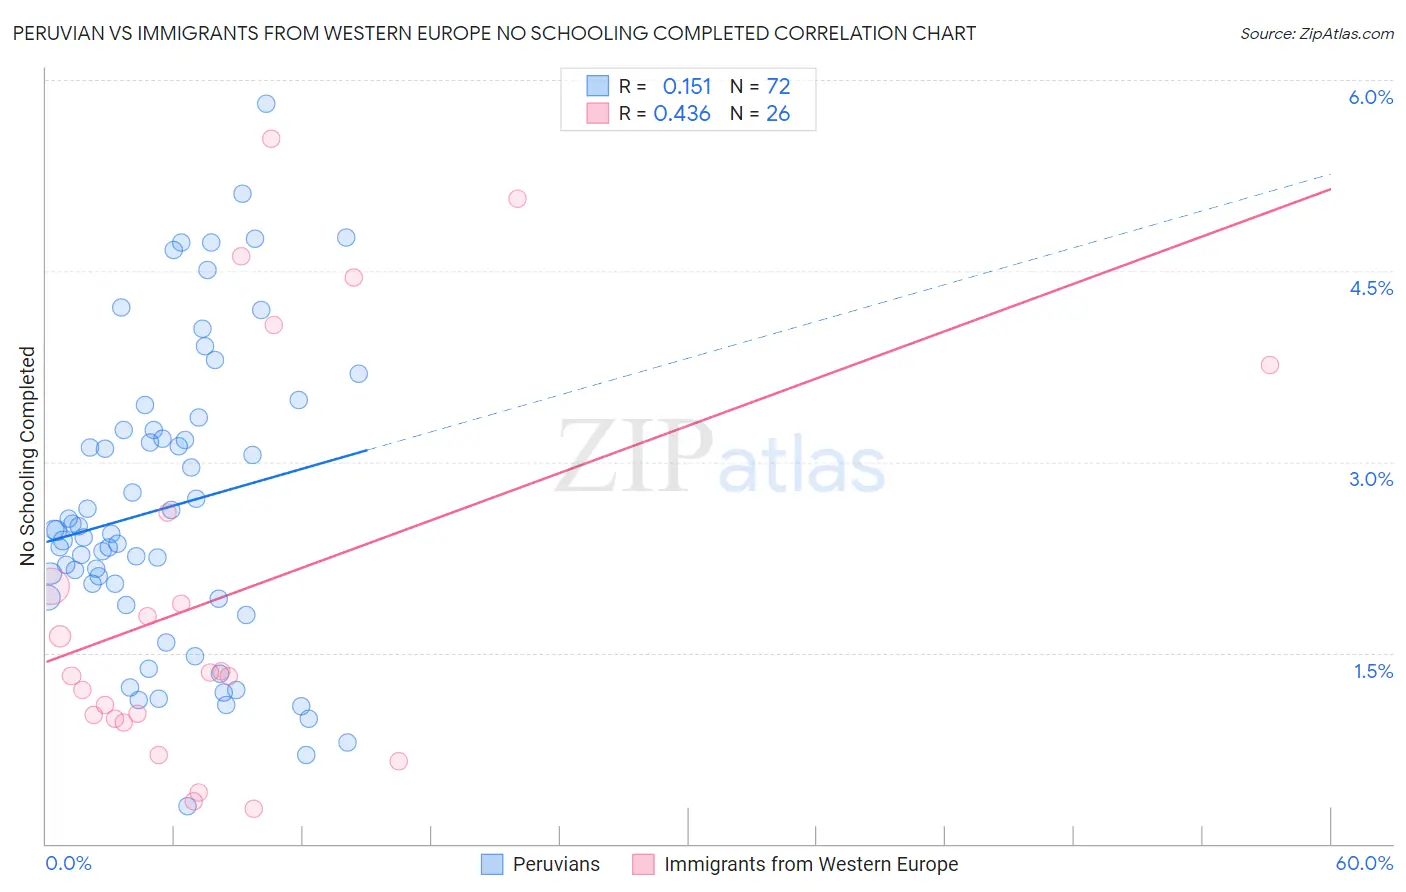
Peruvian vs Immigrants from Western Europe No Schooling Completed Correlation Chart
The statistical analysis conducted on geographies consisting of 360,290,291 people shows a poor positive correlation between the proportion of Peruvians and percentage of population with no schooling in the United States with a correlation coefficient (R) of 0.151 and weighted average of 2.4%. Similarly, the statistical analysis conducted on geographies consisting of 485,224,363 people shows a moderate positive correlation between the proportion of Immigrants from Western Europe and percentage of population with no schooling in the United States with a correlation coefficient (R) of 0.436 and weighted average of 1.8%, a difference of 36.0%.
No Schooling Completed Correlation Summary
| Measurement | Peruvian | Immigrants from Western Europe |
| Minimum | 0.29% | 0.27% |
| Maximum | 5.8% | 5.5% |
| Range | 5.5% | 5.3% |
| Mean | 2.6% | 2.0% |
| Median | 2.4% | 1.3% |
| Interquartile 25% (IQ1) | 1.9% | 0.98% |
| Interquartile 75% (IQ3) | 3.2% | 2.6% |
| Interquartile Range (IQR) | 1.3% | 1.6% |
| Standard Deviation (Sample) | 1.2% | 1.6% |
| Standard Deviation (Population) | 1.2% | 1.5% |
Similar Demographics by No Schooling Completed
Demographics Similar to Peruvians by No Schooling Completed
In terms of no schooling completed, the demographic groups most similar to Peruvians are Bolivian (2.4%, a difference of 0.010%), Immigrants from Congo (2.4%, a difference of 0.050%), South American (2.4%, a difference of 0.11%), Immigrants from Indonesia (2.4%, a difference of 0.14%), and Immigrants from Iraq (2.4%, a difference of 0.16%).
| Demographics | Rating | Rank | No Schooling Completed |
| Immigrants | Eastern Asia | 2.0 /100 | #237 | Tragic 2.4% |
| Paiute | 1.9 /100 | #238 | Tragic 2.4% |
| Liberians | 1.8 /100 | #239 | Tragic 2.4% |
| Immigrants | Senegal | 1.7 /100 | #240 | Tragic 2.4% |
| Koreans | 1.7 /100 | #241 | Tragic 2.4% |
| Immigrants | Indonesia | 1.5 /100 | #242 | Tragic 2.4% |
| South Americans | 1.5 /100 | #243 | Tragic 2.4% |
| Peruvians | 1.4 /100 | #244 | Tragic 2.4% |
| Bolivians | 1.4 /100 | #245 | Tragic 2.4% |
| Immigrants | Congo | 1.4 /100 | #246 | Tragic 2.4% |
| Immigrants | Iraq | 1.3 /100 | #247 | Tragic 2.4% |
| Asians | 1.2 /100 | #248 | Tragic 2.4% |
| Jamaicans | 1.2 /100 | #249 | Tragic 2.4% |
| Immigrants | Middle Africa | 1.1 /100 | #250 | Tragic 2.4% |
| Immigrants | Africa | 1.1 /100 | #251 | Tragic 2.4% |
Demographics Similar to Immigrants from Western Europe by No Schooling Completed
In terms of no schooling completed, the demographic groups most similar to Immigrants from Western Europe are Osage (1.8%, a difference of 0.040%), South African (1.8%, a difference of 0.040%), Ukrainian (1.8%, a difference of 0.36%), Immigrants from Australia (1.7%, a difference of 0.40%), and Immigrants from Denmark (1.7%, a difference of 0.44%).
| Demographics | Rating | Rank | No Schooling Completed |
| Icelanders | 99.3 /100 | #81 | Exceptional 1.7% |
| Immigrants | South Africa | 99.3 /100 | #82 | Exceptional 1.7% |
| Potawatomi | 99.3 /100 | #83 | Exceptional 1.7% |
| Immigrants | Denmark | 99.2 /100 | #84 | Exceptional 1.7% |
| Immigrants | Australia | 99.2 /100 | #85 | Exceptional 1.7% |
| Ukrainians | 99.2 /100 | #86 | Exceptional 1.8% |
| Osage | 99.2 /100 | #87 | Exceptional 1.8% |
| Immigrants | Western Europe | 99.2 /100 | #88 | Exceptional 1.8% |
| South Africans | 99.1 /100 | #89 | Exceptional 1.8% |
| Sioux | 99.0 /100 | #90 | Exceptional 1.8% |
| Immigrants | Germany | 99.0 /100 | #91 | Exceptional 1.8% |
| Romanians | 98.8 /100 | #92 | Exceptional 1.8% |
| Turks | 98.7 /100 | #93 | Exceptional 1.8% |
| Immigrants | Nonimmigrants | 98.5 /100 | #94 | Exceptional 1.8% |
| Puget Sound Salish | 98.5 /100 | #95 | Exceptional 1.8% |