Peruvian vs Immigrants from Vietnam No Schooling Completed
COMPARE
Peruvian
Immigrants from Vietnam
No Schooling Completed
No Schooling Completed Comparison
Peruvians
Immigrants from Vietnam
2.4%
NO SCHOOLING COMPLETED
1.4/ 100
METRIC RATING
244th/ 347
METRIC RANK
3.3%
NO SCHOOLING COMPLETED
0.0/ 100
METRIC RATING
329th/ 347
METRIC RANK
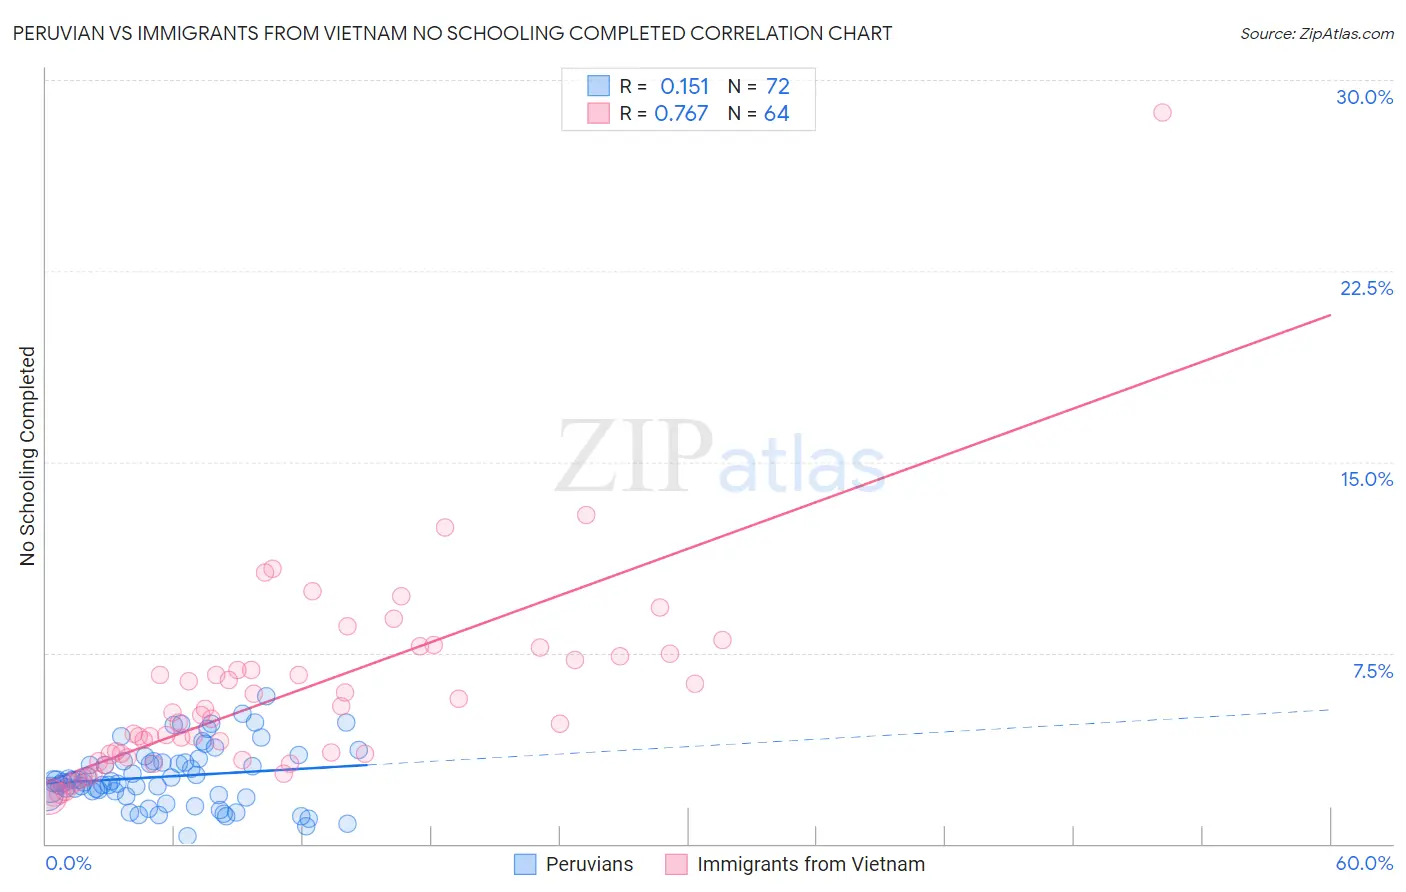
Peruvian vs Immigrants from Vietnam No Schooling Completed Correlation Chart
The statistical analysis conducted on geographies consisting of 360,290,291 people shows a poor positive correlation between the proportion of Peruvians and percentage of population with no schooling in the United States with a correlation coefficient (R) of 0.151 and weighted average of 2.4%. Similarly, the statistical analysis conducted on geographies consisting of 401,890,779 people shows a strong positive correlation between the proportion of Immigrants from Vietnam and percentage of population with no schooling in the United States with a correlation coefficient (R) of 0.767 and weighted average of 3.3%, a difference of 39.5%.
No Schooling Completed Correlation Summary
| Measurement | Peruvian | Immigrants from Vietnam |
| Minimum | 0.29% | 1.9% |
| Maximum | 5.8% | 28.7% |
| Range | 5.5% | 26.8% |
| Mean | 2.6% | 5.9% |
| Median | 2.4% | 5.0% |
| Interquartile 25% (IQ1) | 1.9% | 3.5% |
| Interquartile 75% (IQ3) | 3.2% | 7.3% |
| Interquartile Range (IQR) | 1.3% | 3.8% |
| Standard Deviation (Sample) | 1.2% | 3.9% |
| Standard Deviation (Population) | 1.2% | 3.9% |
Similar Demographics by No Schooling Completed
Demographics Similar to Peruvians by No Schooling Completed
In terms of no schooling completed, the demographic groups most similar to Peruvians are Bolivian (2.4%, a difference of 0.010%), Immigrants from Congo (2.4%, a difference of 0.050%), South American (2.4%, a difference of 0.11%), Immigrants from Indonesia (2.4%, a difference of 0.14%), and Immigrants from Iraq (2.4%, a difference of 0.16%).
| Demographics | Rating | Rank | No Schooling Completed |
| Immigrants | Eastern Asia | 2.0 /100 | #237 | Tragic 2.4% |
| Paiute | 1.9 /100 | #238 | Tragic 2.4% |
| Liberians | 1.8 /100 | #239 | Tragic 2.4% |
| Immigrants | Senegal | 1.7 /100 | #240 | Tragic 2.4% |
| Koreans | 1.7 /100 | #241 | Tragic 2.4% |
| Immigrants | Indonesia | 1.5 /100 | #242 | Tragic 2.4% |
| South Americans | 1.5 /100 | #243 | Tragic 2.4% |
| Peruvians | 1.4 /100 | #244 | Tragic 2.4% |
| Bolivians | 1.4 /100 | #245 | Tragic 2.4% |
| Immigrants | Congo | 1.4 /100 | #246 | Tragic 2.4% |
| Immigrants | Iraq | 1.3 /100 | #247 | Tragic 2.4% |
| Asians | 1.2 /100 | #248 | Tragic 2.4% |
| Jamaicans | 1.2 /100 | #249 | Tragic 2.4% |
| Immigrants | Middle Africa | 1.1 /100 | #250 | Tragic 2.4% |
| Immigrants | Africa | 1.1 /100 | #251 | Tragic 2.4% |
Demographics Similar to Immigrants from Vietnam by No Schooling Completed
In terms of no schooling completed, the demographic groups most similar to Immigrants from Vietnam are Immigrants from Armenia (3.3%, a difference of 0.42%), Japanese (3.3%, a difference of 0.45%), Mexican (3.3%, a difference of 1.1%), Immigrants from Latin America (3.3%, a difference of 1.3%), and Central American (3.4%, a difference of 2.0%).
| Demographics | Rating | Rank | No Schooling Completed |
| Immigrants | Honduras | 0.0 /100 | #322 | Tragic 3.2% |
| Vietnamese | 0.0 /100 | #323 | Tragic 3.2% |
| Mexican American Indians | 0.0 /100 | #324 | Tragic 3.2% |
| Dominicans | 0.0 /100 | #325 | Tragic 3.2% |
| Indonesians | 0.0 /100 | #326 | Tragic 3.2% |
| Immigrants | Latin America | 0.0 /100 | #327 | Tragic 3.3% |
| Mexicans | 0.0 /100 | #328 | Tragic 3.3% |
| Immigrants | Vietnam | 0.0 /100 | #329 | Tragic 3.3% |
| Immigrants | Armenia | 0.0 /100 | #330 | Tragic 3.3% |
| Japanese | 0.0 /100 | #331 | Tragic 3.3% |
| Central Americans | 0.0 /100 | #332 | Tragic 3.4% |
| Immigrants | Dominican Republic | 0.0 /100 | #333 | Tragic 3.4% |
| Guatemalans | 0.0 /100 | #334 | Tragic 3.5% |
| Immigrants | Cambodia | 0.0 /100 | #335 | Tragic 3.5% |
| Immigrants | Fiji | 0.0 /100 | #336 | Tragic 3.5% |