Italian vs Immigrants from Zimbabwe No Schooling Completed
COMPARE
Italian
Immigrants from Zimbabwe
No Schooling Completed
No Schooling Completed Comparison
Italians
Immigrants from Zimbabwe
1.5%
NO SCHOOLING COMPLETED
100.0/ 100
METRIC RATING
33rd/ 347
METRIC RANK
1.9%
NO SCHOOLING COMPLETED
96.2/ 100
METRIC RATING
113th/ 347
METRIC RANK
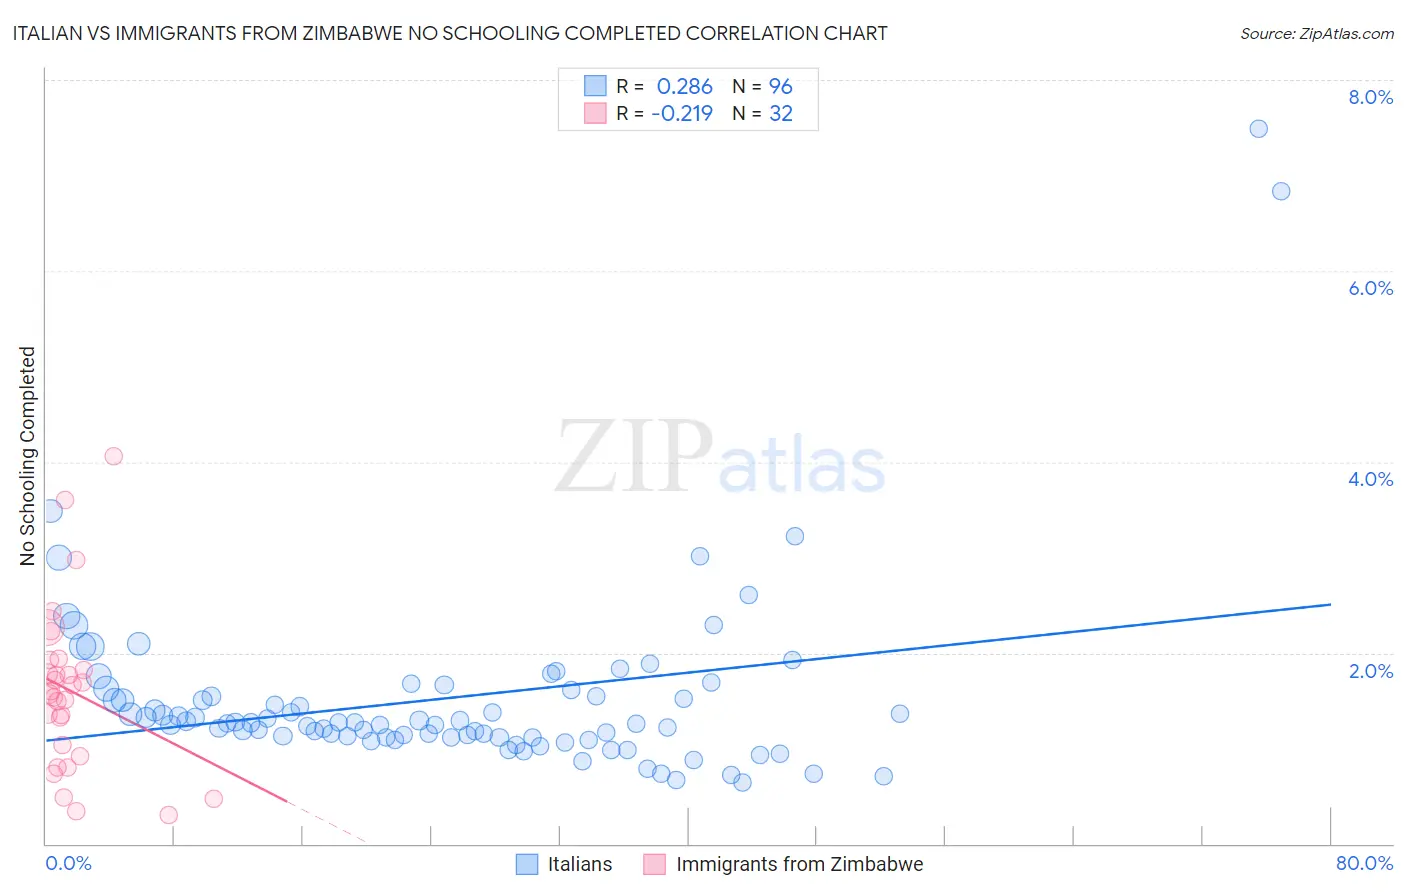
Italian vs Immigrants from Zimbabwe No Schooling Completed Correlation Chart
The statistical analysis conducted on geographies consisting of 555,839,647 people shows a weak positive correlation between the proportion of Italians and percentage of population with no schooling in the United States with a correlation coefficient (R) of 0.286 and weighted average of 1.5%. Similarly, the statistical analysis conducted on geographies consisting of 117,317,666 people shows a weak negative correlation between the proportion of Immigrants from Zimbabwe and percentage of population with no schooling in the United States with a correlation coefficient (R) of -0.219 and weighted average of 1.9%, a difference of 21.2%.
No Schooling Completed Correlation Summary
| Measurement | Italian | Immigrants from Zimbabwe |
| Minimum | 0.64% | 0.31% |
| Maximum | 7.5% | 4.1% |
| Range | 6.8% | 3.8% |
| Mean | 1.5% | 1.6% |
| Median | 1.3% | 1.6% |
| Interquartile 25% (IQ1) | 1.1% | 0.97% |
| Interquartile 75% (IQ3) | 1.6% | 1.9% |
| Interquartile Range (IQR) | 0.47% | 0.90% |
| Standard Deviation (Sample) | 0.98% | 0.86% |
| Standard Deviation (Population) | 0.98% | 0.84% |
Similar Demographics by No Schooling Completed
Demographics Similar to Italians by No Schooling Completed
In terms of no schooling completed, the demographic groups most similar to Italians are Latvian (1.5%, a difference of 0.25%), Swiss (1.5%, a difference of 0.68%), Inupiat (1.5%, a difference of 1.1%), British (1.5%, a difference of 1.1%), and Eastern European (1.6%, a difference of 1.2%).
| Demographics | Rating | Rank | No Schooling Completed |
| Czechs | 100.0 /100 | #26 | Exceptional 1.5% |
| Scandinavians | 100.0 /100 | #27 | Exceptional 1.5% |
| French Canadians | 100.0 /100 | #28 | Exceptional 1.5% |
| Lumbee | 100.0 /100 | #29 | Exceptional 1.5% |
| British | 100.0 /100 | #30 | Exceptional 1.5% |
| Inupiat | 100.0 /100 | #31 | Exceptional 1.5% |
| Swiss | 100.0 /100 | #32 | Exceptional 1.5% |
| Italians | 100.0 /100 | #33 | Exceptional 1.5% |
| Latvians | 100.0 /100 | #34 | Exceptional 1.5% |
| Eastern Europeans | 100.0 /100 | #35 | Exceptional 1.6% |
| Aleuts | 99.9 /100 | #36 | Exceptional 1.6% |
| Belgians | 99.9 /100 | #37 | Exceptional 1.6% |
| Northern Europeans | 99.9 /100 | #38 | Exceptional 1.6% |
| Native Hawaiians | 99.9 /100 | #39 | Exceptional 1.6% |
| Luxembourgers | 99.9 /100 | #40 | Exceptional 1.6% |
Demographics Similar to Immigrants from Zimbabwe by No Schooling Completed
In terms of no schooling completed, the demographic groups most similar to Immigrants from Zimbabwe are Immigrants from Norway (1.9%, a difference of 0.010%), Syrian (1.9%, a difference of 0.14%), Lebanese (1.9%, a difference of 0.16%), Pueblo (1.9%, a difference of 0.25%), and Immigrants from Serbia (1.9%, a difference of 0.36%).
| Demographics | Rating | Rank | No Schooling Completed |
| Immigrants | France | 97.3 /100 | #106 | Exceptional 1.8% |
| Yugoslavians | 97.2 /100 | #107 | Exceptional 1.8% |
| Okinawans | 97.1 /100 | #108 | Exceptional 1.8% |
| Immigrants | Saudi Arabia | 96.8 /100 | #109 | Exceptional 1.9% |
| Immigrants | Latvia | 96.7 /100 | #110 | Exceptional 1.9% |
| Immigrants | Japan | 96.6 /100 | #111 | Exceptional 1.9% |
| Pueblo | 96.4 /100 | #112 | Exceptional 1.9% |
| Immigrants | Zimbabwe | 96.2 /100 | #113 | Exceptional 1.9% |
| Immigrants | Norway | 96.1 /100 | #114 | Exceptional 1.9% |
| Syrians | 96.0 /100 | #115 | Exceptional 1.9% |
| Lebanese | 96.0 /100 | #116 | Exceptional 1.9% |
| Immigrants | Serbia | 95.8 /100 | #117 | Exceptional 1.9% |
| Spanish | 95.5 /100 | #118 | Exceptional 1.9% |
| Iroquois | 95.1 /100 | #119 | Exceptional 1.9% |
| Immigrants | Bulgaria | 94.6 /100 | #120 | Exceptional 1.9% |