Peruvian vs Panamanian No Schooling Completed
COMPARE
Peruvian
Panamanian
No Schooling Completed
No Schooling Completed Comparison
Peruvians
Panamanians
2.4%
NO SCHOOLING COMPLETED
1.4/ 100
METRIC RATING
244th/ 347
METRIC RANK
2.1%
NO SCHOOLING COMPLETED
45.2/ 100
METRIC RATING
176th/ 347
METRIC RANK
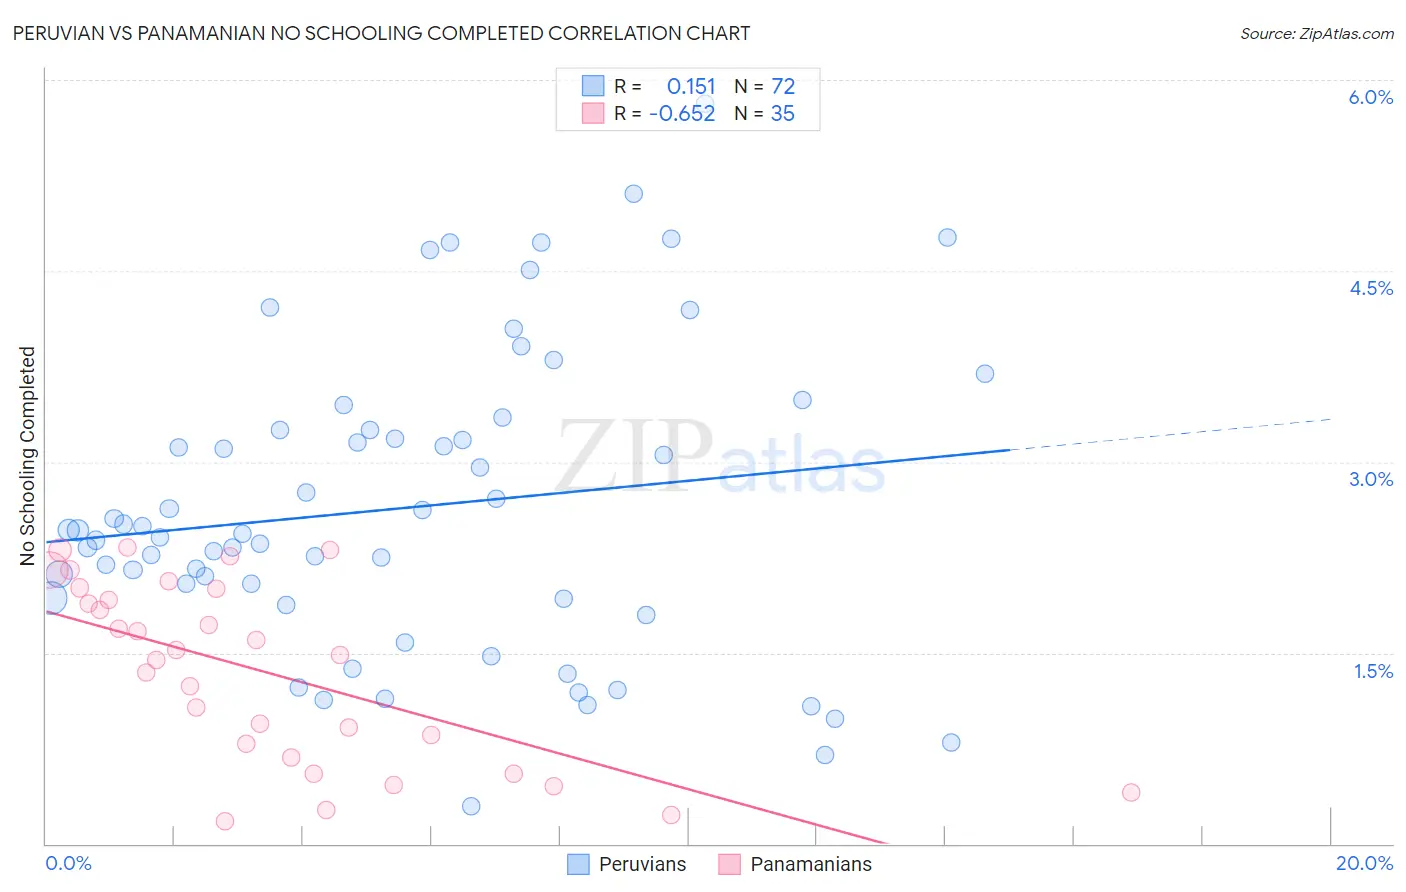
Peruvian vs Panamanian No Schooling Completed Correlation Chart
The statistical analysis conducted on geographies consisting of 360,290,291 people shows a poor positive correlation between the proportion of Peruvians and percentage of population with no schooling in the United States with a correlation coefficient (R) of 0.151 and weighted average of 2.4%. Similarly, the statistical analysis conducted on geographies consisting of 279,950,007 people shows a significant negative correlation between the proportion of Panamanians and percentage of population with no schooling in the United States with a correlation coefficient (R) of -0.652 and weighted average of 2.1%, a difference of 13.5%.
No Schooling Completed Correlation Summary
| Measurement | Peruvian | Panamanian |
| Minimum | 0.29% | 0.18% |
| Maximum | 5.8% | 2.3% |
| Range | 5.5% | 2.1% |
| Mean | 2.6% | 1.4% |
| Median | 2.4% | 1.5% |
| Interquartile 25% (IQ1) | 1.9% | 0.68% |
| Interquartile 75% (IQ3) | 3.2% | 2.0% |
| Interquartile Range (IQR) | 1.3% | 1.3% |
| Standard Deviation (Sample) | 1.2% | 0.70% |
| Standard Deviation (Population) | 1.2% | 0.69% |
Similar Demographics by No Schooling Completed
Demographics Similar to Peruvians by No Schooling Completed
In terms of no schooling completed, the demographic groups most similar to Peruvians are Bolivian (2.4%, a difference of 0.010%), Immigrants from Congo (2.4%, a difference of 0.050%), South American (2.4%, a difference of 0.11%), Immigrants from Indonesia (2.4%, a difference of 0.14%), and Immigrants from Iraq (2.4%, a difference of 0.16%).
| Demographics | Rating | Rank | No Schooling Completed |
| Immigrants | Eastern Asia | 2.0 /100 | #237 | Tragic 2.4% |
| Paiute | 1.9 /100 | #238 | Tragic 2.4% |
| Liberians | 1.8 /100 | #239 | Tragic 2.4% |
| Immigrants | Senegal | 1.7 /100 | #240 | Tragic 2.4% |
| Koreans | 1.7 /100 | #241 | Tragic 2.4% |
| Immigrants | Indonesia | 1.5 /100 | #242 | Tragic 2.4% |
| South Americans | 1.5 /100 | #243 | Tragic 2.4% |
| Peruvians | 1.4 /100 | #244 | Tragic 2.4% |
| Bolivians | 1.4 /100 | #245 | Tragic 2.4% |
| Immigrants | Congo | 1.4 /100 | #246 | Tragic 2.4% |
| Immigrants | Iraq | 1.3 /100 | #247 | Tragic 2.4% |
| Asians | 1.2 /100 | #248 | Tragic 2.4% |
| Jamaicans | 1.2 /100 | #249 | Tragic 2.4% |
| Immigrants | Middle Africa | 1.1 /100 | #250 | Tragic 2.4% |
| Immigrants | Africa | 1.1 /100 | #251 | Tragic 2.4% |
Demographics Similar to Panamanians by No Schooling Completed
In terms of no schooling completed, the demographic groups most similar to Panamanians are Arapaho (2.1%, a difference of 0.020%), Pakistani (2.1%, a difference of 0.060%), Immigrants from Kazakhstan (2.1%, a difference of 0.11%), Arab (2.1%, a difference of 0.17%), and Portuguese (2.1%, a difference of 0.17%).
| Demographics | Rating | Rank | No Schooling Completed |
| Apache | 56.7 /100 | #169 | Average 2.1% |
| Argentineans | 56.0 /100 | #170 | Average 2.1% |
| Immigrants | Poland | 55.2 /100 | #171 | Average 2.1% |
| Immigrants | Argentina | 52.7 /100 | #172 | Average 2.1% |
| Immigrants | Belarus | 51.8 /100 | #173 | Average 2.1% |
| Immigrants | Micronesia | 50.0 /100 | #174 | Average 2.1% |
| Arabs | 46.4 /100 | #175 | Average 2.1% |
| Panamanians | 45.2 /100 | #176 | Average 2.1% |
| Arapaho | 45.0 /100 | #177 | Average 2.1% |
| Pakistanis | 44.7 /100 | #178 | Average 2.1% |
| Immigrants | Kazakhstan | 44.3 /100 | #179 | Average 2.1% |
| Portuguese | 43.9 /100 | #180 | Average 2.1% |
| Immigrants | Taiwan | 42.6 /100 | #181 | Average 2.1% |
| French American Indians | 42.2 /100 | #182 | Average 2.1% |
| Blacks/African Americans | 41.4 /100 | #183 | Average 2.1% |