Immigrants from Peru vs Immigrants from Zimbabwe No Schooling Completed
COMPARE
Immigrants from Peru
Immigrants from Zimbabwe
No Schooling Completed
No Schooling Completed Comparison
Immigrants from Peru
Immigrants from Zimbabwe
2.5%
NO SCHOOLING COMPLETED
0.2/ 100
METRIC RATING
270th/ 347
METRIC RANK
1.9%
NO SCHOOLING COMPLETED
96.2/ 100
METRIC RATING
113th/ 347
METRIC RANK
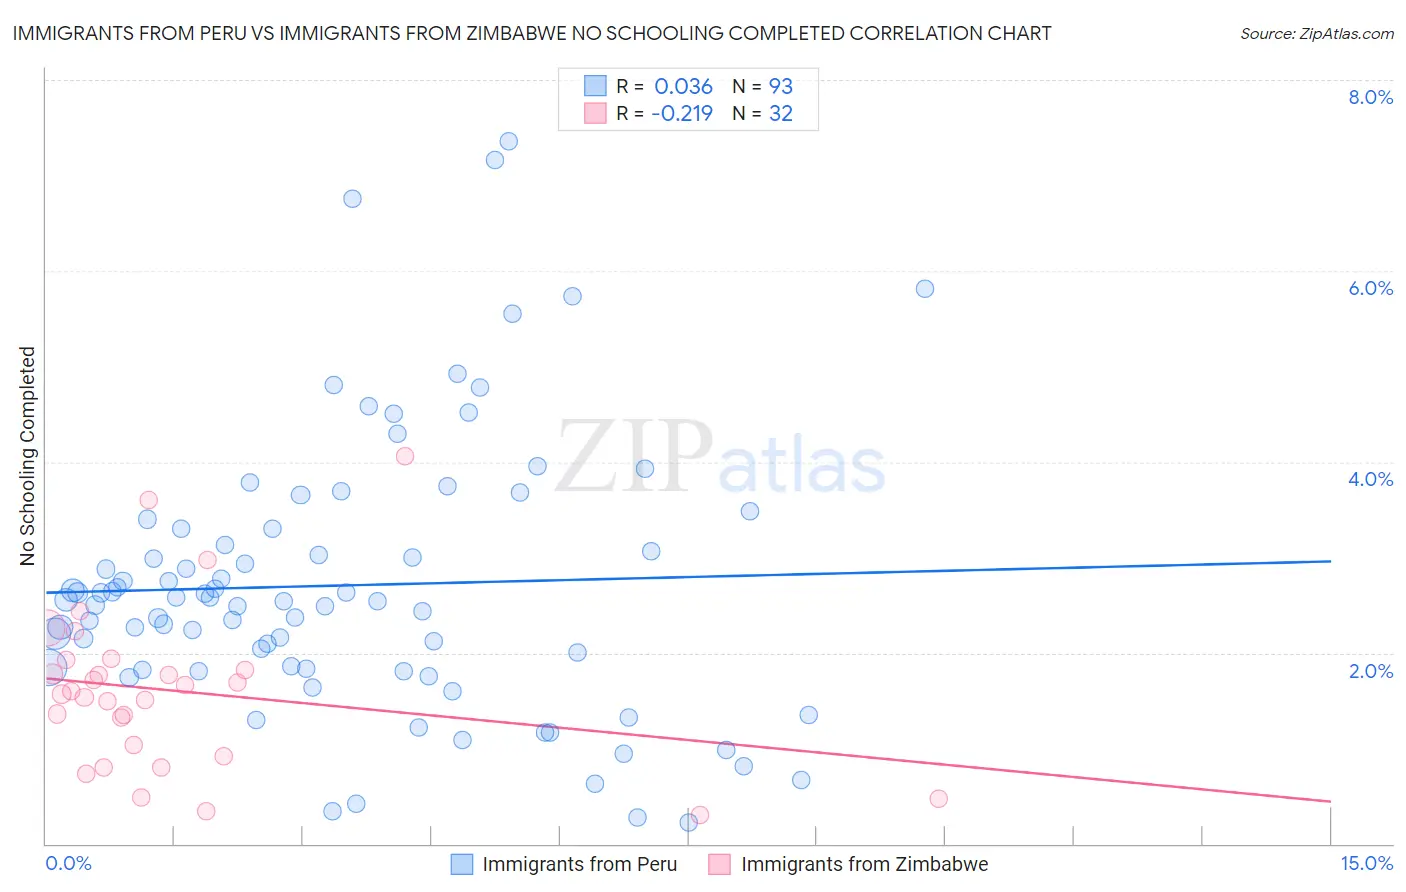
Immigrants from Peru vs Immigrants from Zimbabwe No Schooling Completed Correlation Chart
The statistical analysis conducted on geographies consisting of 326,728,485 people shows no correlation between the proportion of Immigrants from Peru and percentage of population with no schooling in the United States with a correlation coefficient (R) of 0.036 and weighted average of 2.5%. Similarly, the statistical analysis conducted on geographies consisting of 117,317,666 people shows a weak negative correlation between the proportion of Immigrants from Zimbabwe and percentage of population with no schooling in the United States with a correlation coefficient (R) of -0.219 and weighted average of 1.9%, a difference of 34.8%.
No Schooling Completed Correlation Summary
| Measurement | Immigrants from Peru | Immigrants from Zimbabwe |
| Minimum | 0.23% | 0.31% |
| Maximum | 7.4% | 4.1% |
| Range | 7.1% | 3.8% |
| Mean | 2.7% | 1.6% |
| Median | 2.5% | 1.6% |
| Interquartile 25% (IQ1) | 1.8% | 0.97% |
| Interquartile 75% (IQ3) | 3.3% | 1.9% |
| Interquartile Range (IQR) | 1.5% | 0.90% |
| Standard Deviation (Sample) | 1.4% | 0.86% |
| Standard Deviation (Population) | 1.4% | 0.84% |
Similar Demographics by No Schooling Completed
Demographics Similar to Immigrants from Peru by No Schooling Completed
In terms of no schooling completed, the demographic groups most similar to Immigrants from Peru are Cuban (2.5%, a difference of 0.010%), Immigrants from Nigeria (2.5%, a difference of 0.080%), Immigrants from Bolivia (2.5%, a difference of 0.54%), Taiwanese (2.5%, a difference of 0.94%), and Yuman (2.5%, a difference of 1.2%).
| Demographics | Rating | Rank | No Schooling Completed |
| Immigrants | Liberia | 0.4 /100 | #263 | Tragic 2.5% |
| Indians (Asian) | 0.4 /100 | #264 | Tragic 2.5% |
| West Indians | 0.4 /100 | #265 | Tragic 2.5% |
| Fijians | 0.4 /100 | #266 | Tragic 2.5% |
| Yuman | 0.4 /100 | #267 | Tragic 2.5% |
| Taiwanese | 0.3 /100 | #268 | Tragic 2.5% |
| Immigrants | Nigeria | 0.2 /100 | #269 | Tragic 2.5% |
| Immigrants | Peru | 0.2 /100 | #270 | Tragic 2.5% |
| Cubans | 0.2 /100 | #271 | Tragic 2.5% |
| Immigrants | Bolivia | 0.2 /100 | #272 | Tragic 2.5% |
| Immigrants | Cameroon | 0.1 /100 | #273 | Tragic 2.5% |
| Ghanaians | 0.1 /100 | #274 | Tragic 2.6% |
| Immigrants | China | 0.1 /100 | #275 | Tragic 2.6% |
| Immigrants | Western Africa | 0.1 /100 | #276 | Tragic 2.6% |
| Immigrants | Philippines | 0.1 /100 | #277 | Tragic 2.6% |
Demographics Similar to Immigrants from Zimbabwe by No Schooling Completed
In terms of no schooling completed, the demographic groups most similar to Immigrants from Zimbabwe are Immigrants from Norway (1.9%, a difference of 0.010%), Syrian (1.9%, a difference of 0.14%), Lebanese (1.9%, a difference of 0.16%), Pueblo (1.9%, a difference of 0.25%), and Immigrants from Serbia (1.9%, a difference of 0.36%).
| Demographics | Rating | Rank | No Schooling Completed |
| Immigrants | France | 97.3 /100 | #106 | Exceptional 1.8% |
| Yugoslavians | 97.2 /100 | #107 | Exceptional 1.8% |
| Okinawans | 97.1 /100 | #108 | Exceptional 1.8% |
| Immigrants | Saudi Arabia | 96.8 /100 | #109 | Exceptional 1.9% |
| Immigrants | Latvia | 96.7 /100 | #110 | Exceptional 1.9% |
| Immigrants | Japan | 96.6 /100 | #111 | Exceptional 1.9% |
| Pueblo | 96.4 /100 | #112 | Exceptional 1.9% |
| Immigrants | Zimbabwe | 96.2 /100 | #113 | Exceptional 1.9% |
| Immigrants | Norway | 96.1 /100 | #114 | Exceptional 1.9% |
| Syrians | 96.0 /100 | #115 | Exceptional 1.9% |
| Lebanese | 96.0 /100 | #116 | Exceptional 1.9% |
| Immigrants | Serbia | 95.8 /100 | #117 | Exceptional 1.9% |
| Spanish | 95.5 /100 | #118 | Exceptional 1.9% |
| Iroquois | 95.1 /100 | #119 | Exceptional 1.9% |
| Immigrants | Bulgaria | 94.6 /100 | #120 | Exceptional 1.9% |