Peruvian vs Immigrants from Chile No Schooling Completed
COMPARE
Peruvian
Immigrants from Chile
No Schooling Completed
No Schooling Completed Comparison
Peruvians
Immigrants from Chile
2.4%
NO SCHOOLING COMPLETED
1.4/ 100
METRIC RATING
244th/ 347
METRIC RANK
2.2%
NO SCHOOLING COMPLETED
22.7/ 100
METRIC RATING
198th/ 347
METRIC RANK
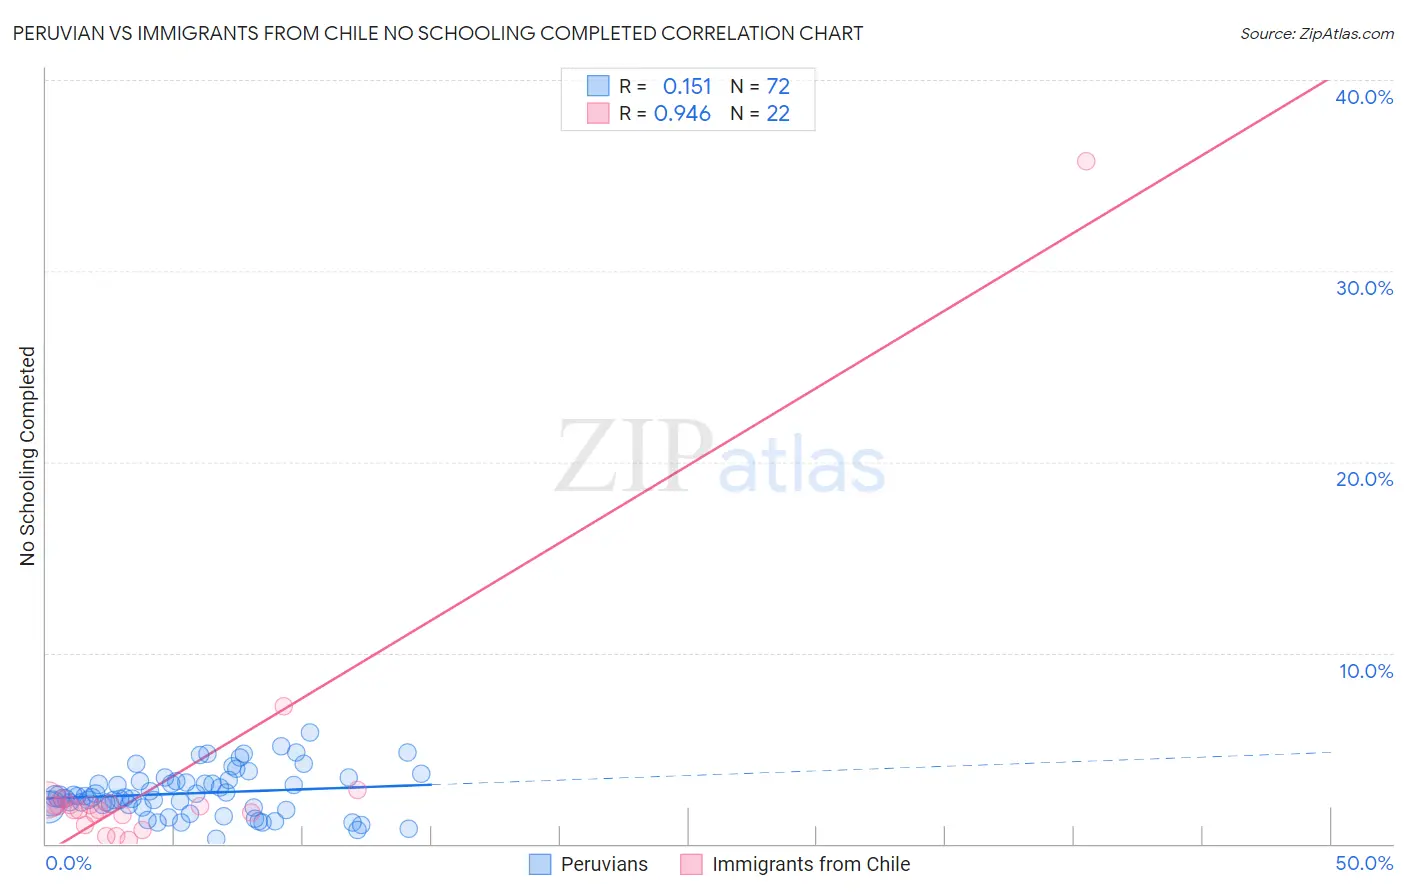
Peruvian vs Immigrants from Chile No Schooling Completed Correlation Chart
The statistical analysis conducted on geographies consisting of 360,290,291 people shows a poor positive correlation between the proportion of Peruvians and percentage of population with no schooling in the United States with a correlation coefficient (R) of 0.151 and weighted average of 2.4%. Similarly, the statistical analysis conducted on geographies consisting of 217,752,126 people shows a near-perfect positive correlation between the proportion of Immigrants from Chile and percentage of population with no schooling in the United States with a correlation coefficient (R) of 0.946 and weighted average of 2.2%, a difference of 9.7%.
No Schooling Completed Correlation Summary
| Measurement | Peruvian | Immigrants from Chile |
| Minimum | 0.29% | 0.21% |
| Maximum | 5.8% | 35.7% |
| Range | 5.5% | 35.5% |
| Mean | 2.6% | 3.4% |
| Median | 2.4% | 1.9% |
| Interquartile 25% (IQ1) | 1.9% | 1.5% |
| Interquartile 75% (IQ3) | 3.2% | 2.1% |
| Interquartile Range (IQR) | 1.3% | 0.53% |
| Standard Deviation (Sample) | 1.2% | 7.3% |
| Standard Deviation (Population) | 1.2% | 7.2% |
Similar Demographics by No Schooling Completed
Demographics Similar to Peruvians by No Schooling Completed
In terms of no schooling completed, the demographic groups most similar to Peruvians are Bolivian (2.4%, a difference of 0.010%), Immigrants from Congo (2.4%, a difference of 0.050%), South American (2.4%, a difference of 0.11%), Immigrants from Indonesia (2.4%, a difference of 0.14%), and Immigrants from Iraq (2.4%, a difference of 0.16%).
| Demographics | Rating | Rank | No Schooling Completed |
| Immigrants | Eastern Asia | 2.0 /100 | #237 | Tragic 2.4% |
| Paiute | 1.9 /100 | #238 | Tragic 2.4% |
| Liberians | 1.8 /100 | #239 | Tragic 2.4% |
| Immigrants | Senegal | 1.7 /100 | #240 | Tragic 2.4% |
| Koreans | 1.7 /100 | #241 | Tragic 2.4% |
| Immigrants | Indonesia | 1.5 /100 | #242 | Tragic 2.4% |
| South Americans | 1.5 /100 | #243 | Tragic 2.4% |
| Peruvians | 1.4 /100 | #244 | Tragic 2.4% |
| Bolivians | 1.4 /100 | #245 | Tragic 2.4% |
| Immigrants | Congo | 1.4 /100 | #246 | Tragic 2.4% |
| Immigrants | Iraq | 1.3 /100 | #247 | Tragic 2.4% |
| Asians | 1.2 /100 | #248 | Tragic 2.4% |
| Jamaicans | 1.2 /100 | #249 | Tragic 2.4% |
| Immigrants | Middle Africa | 1.1 /100 | #250 | Tragic 2.4% |
| Immigrants | Africa | 1.1 /100 | #251 | Tragic 2.4% |
Demographics Similar to Immigrants from Chile by No Schooling Completed
In terms of no schooling completed, the demographic groups most similar to Immigrants from Chile are African (2.2%, a difference of 0.17%), Immigrants from Southern Europe (2.2%, a difference of 0.18%), Immigrants from Ukraine (2.2%, a difference of 0.60%), Immigrants from Northern Africa (2.2%, a difference of 0.64%), and Hawaiian (2.2%, a difference of 0.75%).
| Demographics | Rating | Rank | No Schooling Completed |
| Bermudans | 30.7 /100 | #191 | Fair 2.1% |
| Guamanians/Chamorros | 29.8 /100 | #192 | Fair 2.2% |
| Paraguayans | 29.3 /100 | #193 | Fair 2.2% |
| Immigrants | Albania | 28.3 /100 | #194 | Fair 2.2% |
| Hawaiians | 27.0 /100 | #195 | Fair 2.2% |
| Immigrants | Ukraine | 26.1 /100 | #196 | Fair 2.2% |
| Immigrants | Southern Europe | 23.8 /100 | #197 | Fair 2.2% |
| Immigrants | Chile | 22.7 /100 | #198 | Fair 2.2% |
| Africans | 21.8 /100 | #199 | Fair 2.2% |
| Immigrants | Northern Africa | 19.5 /100 | #200 | Poor 2.2% |
| Costa Ricans | 17.1 /100 | #201 | Poor 2.2% |
| Moroccans | 13.7 /100 | #202 | Poor 2.2% |
| Laotians | 13.3 /100 | #203 | Poor 2.2% |
| Hopi | 12.9 /100 | #204 | Poor 2.2% |
| Immigrants | Bahamas | 11.6 /100 | #205 | Poor 2.2% |