Peruvian vs Immigrants from Zimbabwe 5th Grade
COMPARE
Peruvian
Immigrants from Zimbabwe
5th Grade
5th Grade Comparison
Peruvians
Immigrants from Zimbabwe
96.8%
5TH GRADE
0.6/ 100
METRIC RATING
257th/ 347
METRIC RANK
97.6%
5TH GRADE
94.9/ 100
METRIC RATING
120th/ 347
METRIC RANK
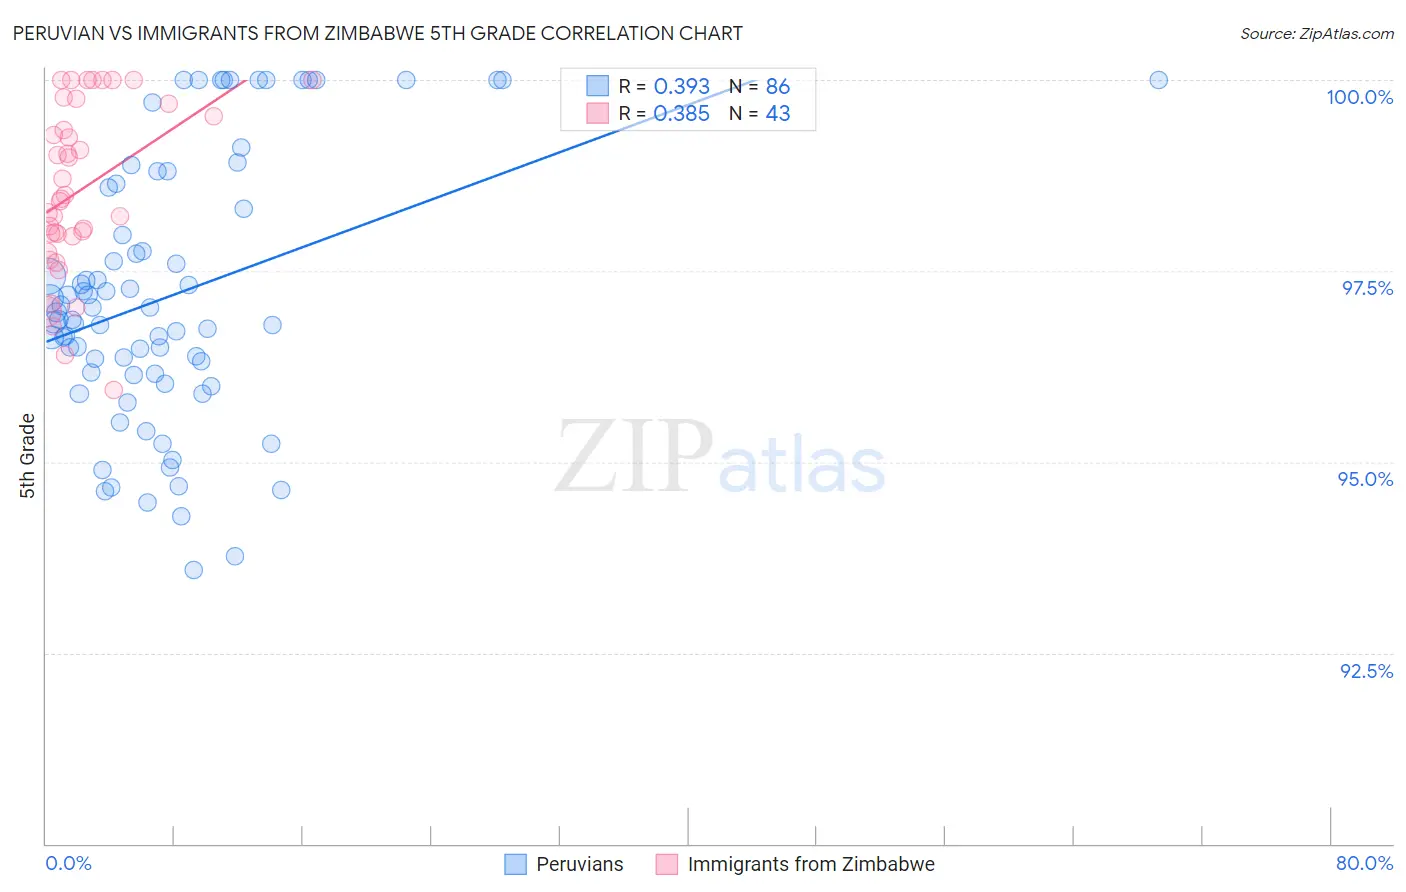
Peruvian vs Immigrants from Zimbabwe 5th Grade Correlation Chart
The statistical analysis conducted on geographies consisting of 363,068,462 people shows a mild positive correlation between the proportion of Peruvians and percentage of population with at least 5th grade education in the United States with a correlation coefficient (R) of 0.393 and weighted average of 96.8%. Similarly, the statistical analysis conducted on geographies consisting of 117,756,150 people shows a mild positive correlation between the proportion of Immigrants from Zimbabwe and percentage of population with at least 5th grade education in the United States with a correlation coefficient (R) of 0.385 and weighted average of 97.6%, a difference of 0.83%.
5th Grade Correlation Summary
| Measurement | Peruvian | Immigrants from Zimbabwe |
| Minimum | 93.6% | 95.9% |
| Maximum | 100.0% | 100.0% |
| Range | 6.4% | 4.1% |
| Mean | 97.2% | 98.6% |
| Median | 96.9% | 98.4% |
| Interquartile 25% (IQ1) | 96.2% | 98.0% |
| Interquartile 75% (IQ3) | 98.6% | 99.7% |
| Interquartile Range (IQR) | 2.4% | 1.7% |
| Standard Deviation (Sample) | 1.7% | 1.1% |
| Standard Deviation (Population) | 1.7% | 1.1% |
Similar Demographics by 5th Grade
Demographics Similar to Peruvians by 5th Grade
In terms of 5th grade, the demographic groups most similar to Peruvians are Immigrants from Congo (96.8%, a difference of 0.0%), South American (96.8%, a difference of 0.010%), Immigrants from Middle Africa (96.8%, a difference of 0.030%), Immigrants from Senegal (96.8%, a difference of 0.030%), and Immigrants from Ethiopia (96.8%, a difference of 0.030%).
| Demographics | Rating | Rank | 5th Grade |
| Immigrants | Liberia | 1.0 /100 | #250 | Tragic 96.9% |
| Bolivians | 0.9 /100 | #251 | Tragic 96.9% |
| Jamaicans | 0.9 /100 | #252 | Tragic 96.9% |
| Immigrants | Middle Africa | 0.8 /100 | #253 | Tragic 96.8% |
| Immigrants | Senegal | 0.8 /100 | #254 | Tragic 96.8% |
| South Americans | 0.7 /100 | #255 | Tragic 96.8% |
| Immigrants | Congo | 0.7 /100 | #256 | Tragic 96.8% |
| Peruvians | 0.6 /100 | #257 | Tragic 96.8% |
| Immigrants | Ethiopia | 0.5 /100 | #258 | Tragic 96.8% |
| Immigrants | China | 0.5 /100 | #259 | Tragic 96.8% |
| Immigrants | Jamaica | 0.4 /100 | #260 | Tragic 96.8% |
| Immigrants | Sierra Leone | 0.4 /100 | #261 | Tragic 96.8% |
| Immigrants | Colombia | 0.4 /100 | #262 | Tragic 96.8% |
| Immigrants | Uzbekistan | 0.3 /100 | #263 | Tragic 96.8% |
| West Indians | 0.3 /100 | #264 | Tragic 96.8% |
Demographics Similar to Immigrants from Zimbabwe by 5th Grade
In terms of 5th grade, the demographic groups most similar to Immigrants from Zimbabwe are Syrian (97.6%, a difference of 0.0%), Immigrants from France (97.6%, a difference of 0.0%), Immigrants from Japan (97.6%, a difference of 0.0%), Immigrants from Saudi Arabia (97.6%, a difference of 0.010%), and Basque (97.6%, a difference of 0.010%).
| Demographics | Rating | Rank | 5th Grade |
| Iroquois | 95.9 /100 | #113 | Exceptional 97.7% |
| Lebanese | 95.7 /100 | #114 | Exceptional 97.6% |
| Okinawans | 95.7 /100 | #115 | Exceptional 97.6% |
| Immigrants | Croatia | 95.5 /100 | #116 | Exceptional 97.6% |
| Immigrants | Saudi Arabia | 95.4 /100 | #117 | Exceptional 97.6% |
| Basques | 95.2 /100 | #118 | Exceptional 97.6% |
| Syrians | 95.1 /100 | #119 | Exceptional 97.6% |
| Immigrants | Zimbabwe | 94.9 /100 | #120 | Exceptional 97.6% |
| Immigrants | France | 94.8 /100 | #121 | Exceptional 97.6% |
| Immigrants | Japan | 94.7 /100 | #122 | Exceptional 97.6% |
| Immigrants | Norway | 94.6 /100 | #123 | Exceptional 97.6% |
| Spanish | 93.7 /100 | #124 | Exceptional 97.6% |
| Immigrants | Bulgaria | 93.1 /100 | #125 | Exceptional 97.6% |
| Hmong | 92.3 /100 | #126 | Exceptional 97.6% |
| Immigrants | Serbia | 92.3 /100 | #127 | Exceptional 97.6% |