Guyanese vs Immigrants from Zimbabwe No Schooling Completed
COMPARE
Guyanese
Immigrants from Zimbabwe
No Schooling Completed
No Schooling Completed Comparison
Guyanese
Immigrants from Zimbabwe
3.0%
NO SCHOOLING COMPLETED
0.0/ 100
METRIC RATING
310th/ 347
METRIC RANK
1.9%
NO SCHOOLING COMPLETED
96.2/ 100
METRIC RATING
113th/ 347
METRIC RANK
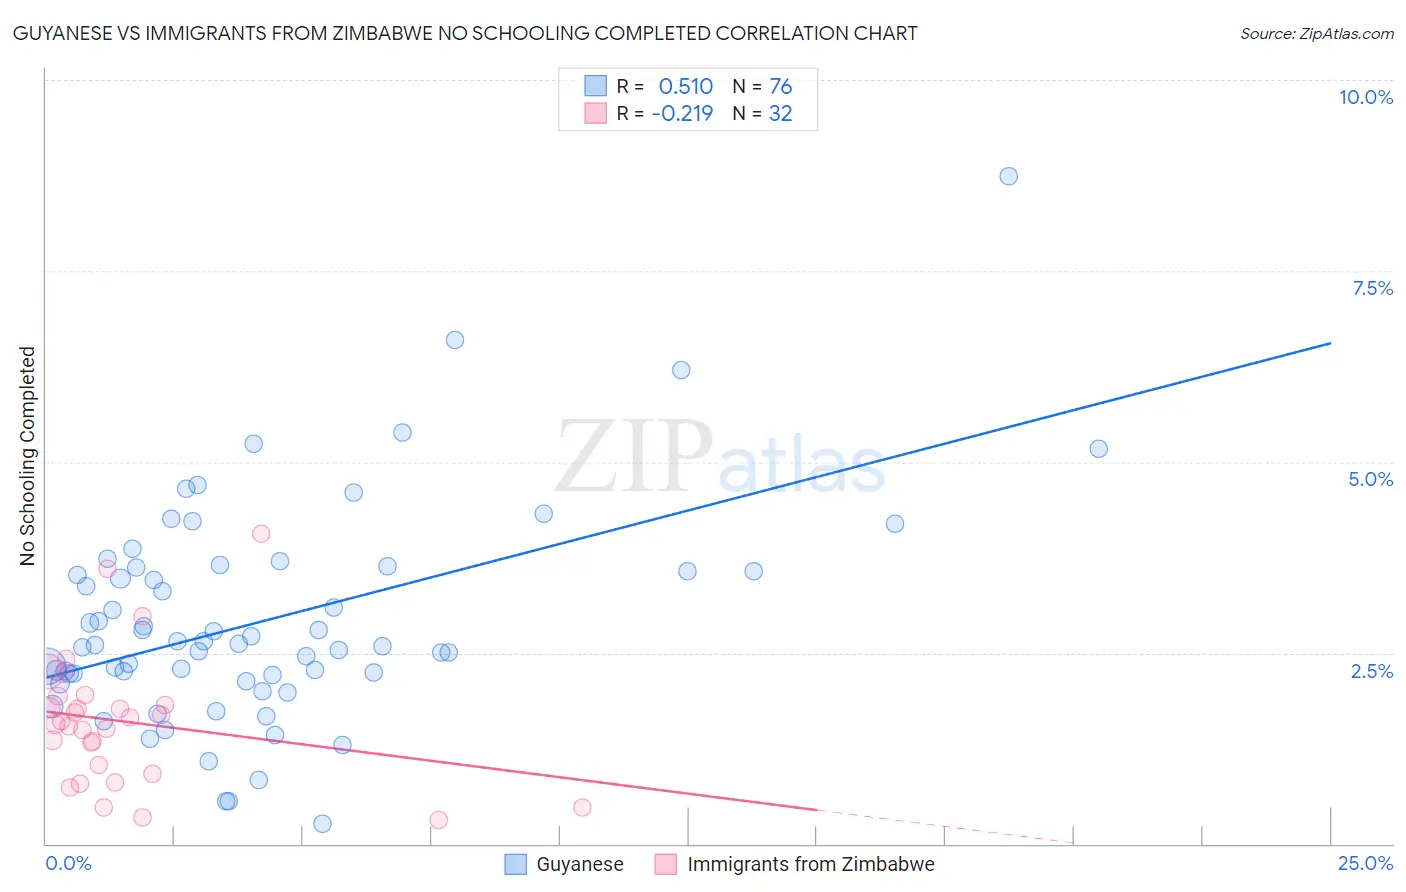
Guyanese vs Immigrants from Zimbabwe No Schooling Completed Correlation Chart
The statistical analysis conducted on geographies consisting of 176,268,002 people shows a substantial positive correlation between the proportion of Guyanese and percentage of population with no schooling in the United States with a correlation coefficient (R) of 0.510 and weighted average of 3.0%. Similarly, the statistical analysis conducted on geographies consisting of 117,317,666 people shows a weak negative correlation between the proportion of Immigrants from Zimbabwe and percentage of population with no schooling in the United States with a correlation coefficient (R) of -0.219 and weighted average of 1.9%, a difference of 62.8%.
No Schooling Completed Correlation Summary
| Measurement | Guyanese | Immigrants from Zimbabwe |
| Minimum | 0.26% | 0.31% |
| Maximum | 8.7% | 4.1% |
| Range | 8.5% | 3.8% |
| Mean | 2.9% | 1.6% |
| Median | 2.6% | 1.6% |
| Interquartile 25% (IQ1) | 2.2% | 0.97% |
| Interquartile 75% (IQ3) | 3.6% | 1.9% |
| Interquartile Range (IQR) | 1.4% | 0.90% |
| Standard Deviation (Sample) | 1.4% | 0.86% |
| Standard Deviation (Population) | 1.4% | 0.84% |
Similar Demographics by No Schooling Completed
Demographics Similar to Guyanese by No Schooling Completed
In terms of no schooling completed, the demographic groups most similar to Guyanese are Hispanic or Latino (3.0%, a difference of 0.050%), Immigrants from the Azores (3.0%, a difference of 0.10%), Sri Lankan (3.0%, a difference of 0.38%), Immigrants from Somalia (3.0%, a difference of 0.86%), and Honduran (3.1%, a difference of 0.89%).
| Demographics | Rating | Rank | No Schooling Completed |
| Somalis | 0.0 /100 | #303 | Tragic 2.9% |
| Nicaraguans | 0.0 /100 | #304 | Tragic 2.9% |
| Ecuadorians | 0.0 /100 | #305 | Tragic 3.0% |
| Belizeans | 0.0 /100 | #306 | Tragic 3.0% |
| Immigrants | Haiti | 0.0 /100 | #307 | Tragic 3.0% |
| Immigrants | Somalia | 0.0 /100 | #308 | Tragic 3.0% |
| Hispanics or Latinos | 0.0 /100 | #309 | Tragic 3.0% |
| Guyanese | 0.0 /100 | #310 | Tragic 3.0% |
| Immigrants | Azores | 0.0 /100 | #311 | Tragic 3.0% |
| Sri Lankans | 0.0 /100 | #312 | Tragic 3.0% |
| Hondurans | 0.0 /100 | #313 | Tragic 3.1% |
| Immigrants | Belize | 0.0 /100 | #314 | Tragic 3.1% |
| Immigrants | Nicaragua | 0.0 /100 | #315 | Tragic 3.1% |
| Immigrants | Ecuador | 0.0 /100 | #316 | Tragic 3.1% |
| Cape Verdeans | 0.0 /100 | #317 | Tragic 3.1% |
Demographics Similar to Immigrants from Zimbabwe by No Schooling Completed
In terms of no schooling completed, the demographic groups most similar to Immigrants from Zimbabwe are Immigrants from Norway (1.9%, a difference of 0.010%), Syrian (1.9%, a difference of 0.14%), Lebanese (1.9%, a difference of 0.16%), Pueblo (1.9%, a difference of 0.25%), and Immigrants from Serbia (1.9%, a difference of 0.36%).
| Demographics | Rating | Rank | No Schooling Completed |
| Immigrants | France | 97.3 /100 | #106 | Exceptional 1.8% |
| Yugoslavians | 97.2 /100 | #107 | Exceptional 1.8% |
| Okinawans | 97.1 /100 | #108 | Exceptional 1.8% |
| Immigrants | Saudi Arabia | 96.8 /100 | #109 | Exceptional 1.9% |
| Immigrants | Latvia | 96.7 /100 | #110 | Exceptional 1.9% |
| Immigrants | Japan | 96.6 /100 | #111 | Exceptional 1.9% |
| Pueblo | 96.4 /100 | #112 | Exceptional 1.9% |
| Immigrants | Zimbabwe | 96.2 /100 | #113 | Exceptional 1.9% |
| Immigrants | Norway | 96.1 /100 | #114 | Exceptional 1.9% |
| Syrians | 96.0 /100 | #115 | Exceptional 1.9% |
| Lebanese | 96.0 /100 | #116 | Exceptional 1.9% |
| Immigrants | Serbia | 95.8 /100 | #117 | Exceptional 1.9% |
| Spanish | 95.5 /100 | #118 | Exceptional 1.9% |
| Iroquois | 95.1 /100 | #119 | Exceptional 1.9% |
| Immigrants | Bulgaria | 94.6 /100 | #120 | Exceptional 1.9% |