Immigrants from Turkey vs Immigrants from Zimbabwe No Schooling Completed
COMPARE
Immigrants from Turkey
Immigrants from Zimbabwe
No Schooling Completed
No Schooling Completed Comparison
Immigrants from Turkey
Immigrants from Zimbabwe
1.9%
NO SCHOOLING COMPLETED
90.2/ 100
METRIC RATING
133rd/ 347
METRIC RANK
1.9%
NO SCHOOLING COMPLETED
96.2/ 100
METRIC RATING
113th/ 347
METRIC RANK
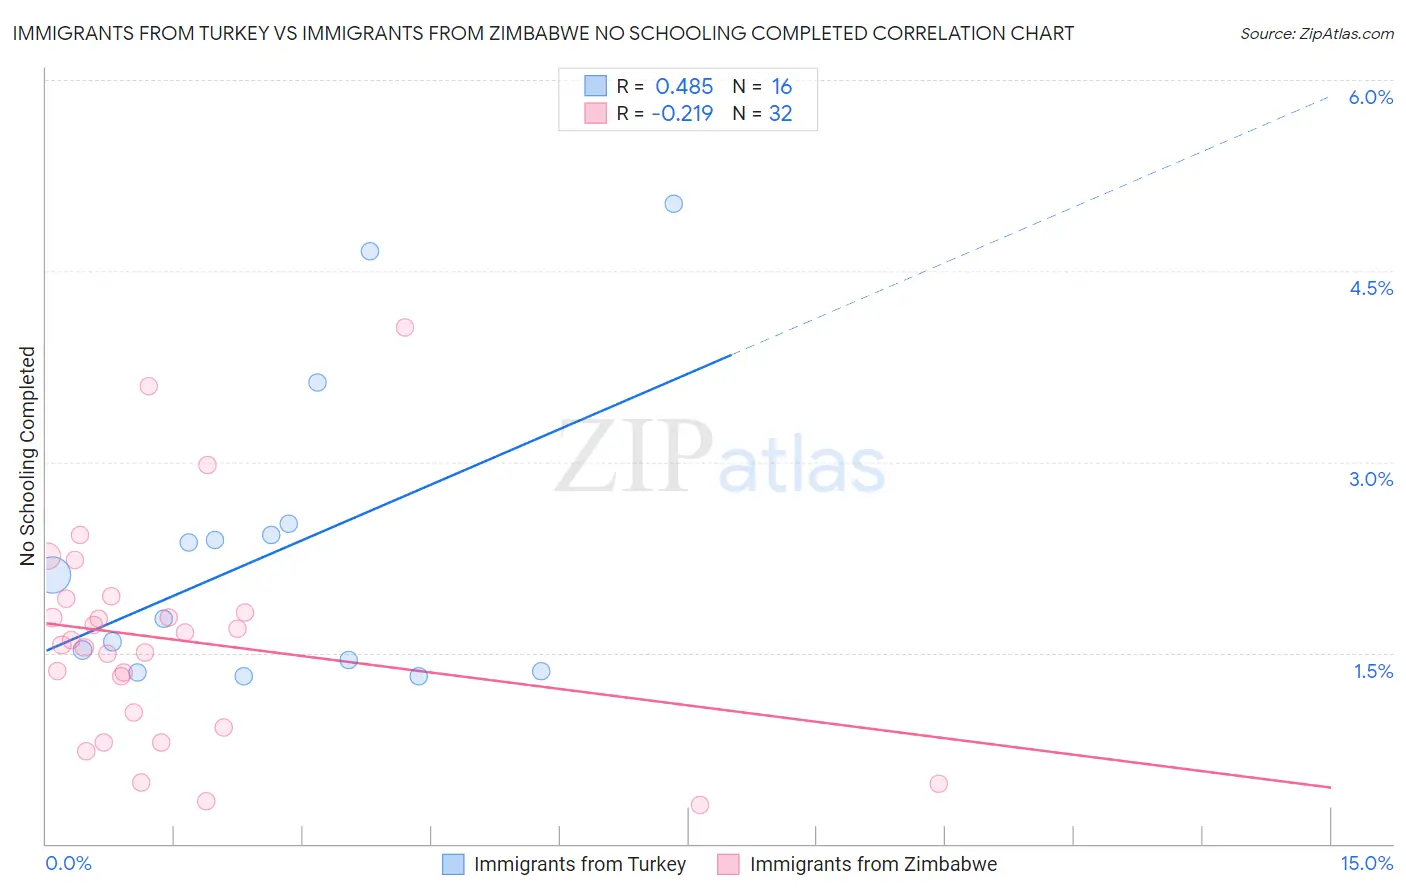
Immigrants from Turkey vs Immigrants from Zimbabwe No Schooling Completed Correlation Chart
The statistical analysis conducted on geographies consisting of 221,912,605 people shows a moderate positive correlation between the proportion of Immigrants from Turkey and percentage of population with no schooling in the United States with a correlation coefficient (R) of 0.485 and weighted average of 1.9%. Similarly, the statistical analysis conducted on geographies consisting of 117,317,666 people shows a weak negative correlation between the proportion of Immigrants from Zimbabwe and percentage of population with no schooling in the United States with a correlation coefficient (R) of -0.219 and weighted average of 1.9%, a difference of 3.8%.
No Schooling Completed Correlation Summary
| Measurement | Immigrants from Turkey | Immigrants from Zimbabwe |
| Minimum | 1.3% | 0.31% |
| Maximum | 5.0% | 4.1% |
| Range | 3.7% | 3.8% |
| Mean | 2.3% | 1.6% |
| Median | 1.9% | 1.6% |
| Interquartile 25% (IQ1) | 1.4% | 0.97% |
| Interquartile 75% (IQ3) | 2.5% | 1.9% |
| Interquartile Range (IQR) | 1.1% | 0.90% |
| Standard Deviation (Sample) | 1.2% | 0.86% |
| Standard Deviation (Population) | 1.1% | 0.84% |
Demographics Similar to Immigrants from Turkey and Immigrants from Zimbabwe by No Schooling Completed
In terms of no schooling completed, the demographic groups most similar to Immigrants from Turkey are Colville (1.9%, a difference of 0.10%), Immigrants from Hungary (1.9%, a difference of 0.60%), Palestinian (1.9%, a difference of 0.71%), Seminole (1.9%, a difference of 0.82%), and Spaniard (1.9%, a difference of 0.96%). Similarly, the demographic groups most similar to Immigrants from Zimbabwe are Immigrants from Norway (1.9%, a difference of 0.010%), Syrian (1.9%, a difference of 0.14%), Lebanese (1.9%, a difference of 0.16%), Immigrants from Serbia (1.9%, a difference of 0.36%), and Spanish (1.9%, a difference of 0.60%).
| Demographics | Rating | Rank | No Schooling Completed |
| Immigrants | Zimbabwe | 96.2 /100 | #113 | Exceptional 1.9% |
| Immigrants | Norway | 96.1 /100 | #114 | Exceptional 1.9% |
| Syrians | 96.0 /100 | #115 | Exceptional 1.9% |
| Lebanese | 96.0 /100 | #116 | Exceptional 1.9% |
| Immigrants | Serbia | 95.8 /100 | #117 | Exceptional 1.9% |
| Spanish | 95.5 /100 | #118 | Exceptional 1.9% |
| Iroquois | 95.1 /100 | #119 | Exceptional 1.9% |
| Immigrants | Bulgaria | 94.6 /100 | #120 | Exceptional 1.9% |
| Immigrants | Croatia | 94.5 /100 | #121 | Exceptional 1.9% |
| Cree | 94.5 /100 | #122 | Exceptional 1.9% |
| Immigrants | Kuwait | 93.9 /100 | #123 | Exceptional 1.9% |
| Cambodians | 93.8 /100 | #124 | Exceptional 1.9% |
| Immigrants | Europe | 93.7 /100 | #125 | Exceptional 1.9% |
| Immigrants | Romania | 92.6 /100 | #126 | Exceptional 1.9% |
| Israelis | 92.4 /100 | #127 | Exceptional 1.9% |
| Spaniards | 92.3 /100 | #128 | Exceptional 1.9% |
| Seminole | 92.0 /100 | #129 | Exceptional 1.9% |
| Palestinians | 91.8 /100 | #130 | Exceptional 1.9% |
| Immigrants | Hungary | 91.6 /100 | #131 | Exceptional 1.9% |
| Colville | 90.4 /100 | #132 | Exceptional 1.9% |
| Immigrants | Turkey | 90.2 /100 | #133 | Exceptional 1.9% |