Peruvian vs Cajun High School Diploma
COMPARE
Peruvian
Cajun
High School Diploma
High School Diploma Comparison
Peruvians
Cajuns
87.8%
HIGH SCHOOL DIPLOMA
1.9/ 100
METRIC RATING
245th/ 347
METRIC RANK
87.3%
HIGH SCHOOL DIPLOMA
0.4/ 100
METRIC RATING
260th/ 347
METRIC RANK
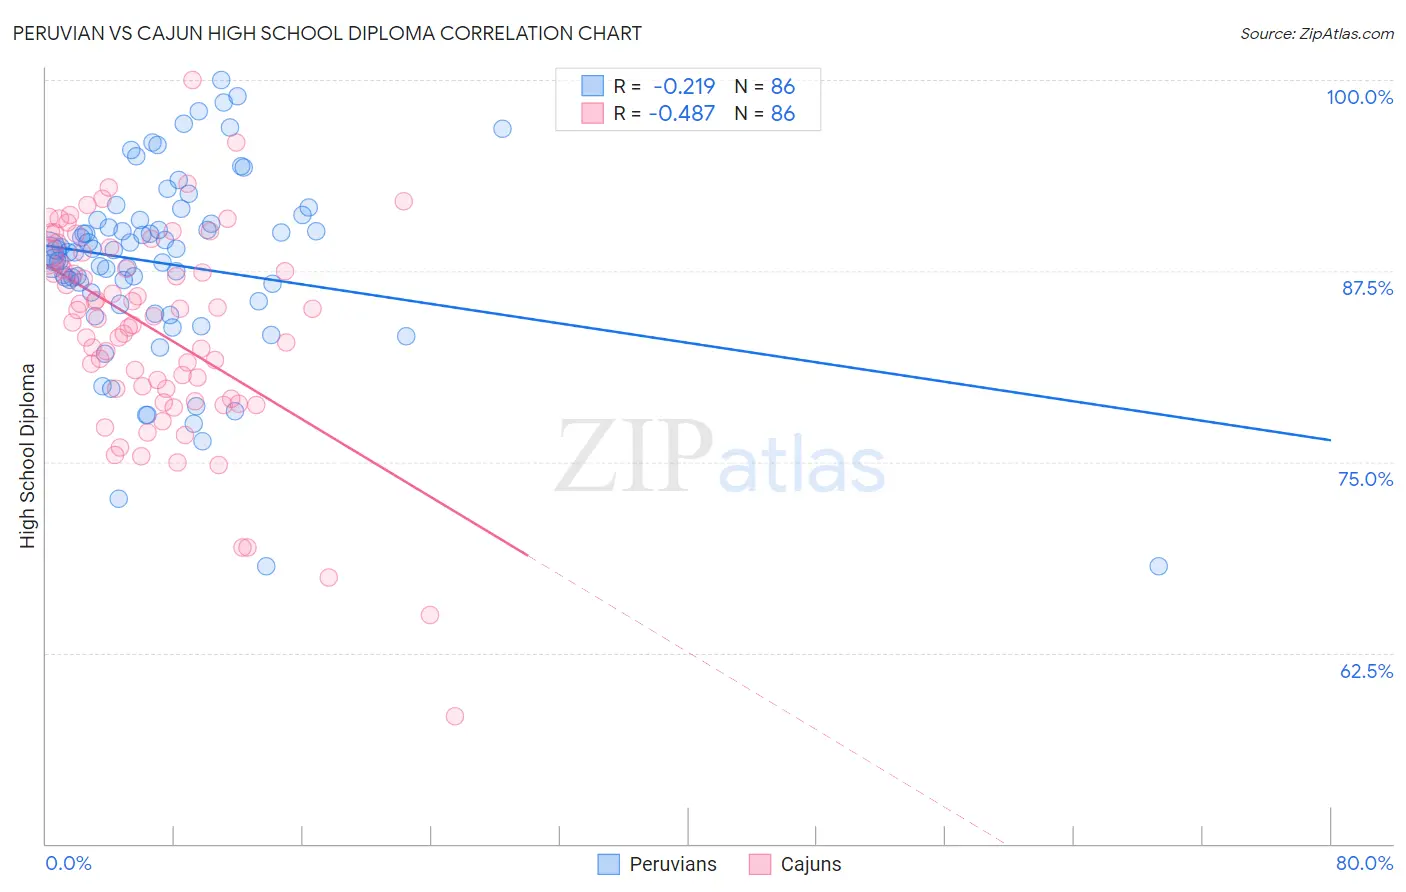
Peruvian vs Cajun High School Diploma Correlation Chart
The statistical analysis conducted on geographies consisting of 363,251,075 people shows a weak negative correlation between the proportion of Peruvians and percentage of population with at least high school diploma education in the United States with a correlation coefficient (R) of -0.219 and weighted average of 87.8%. Similarly, the statistical analysis conducted on geographies consisting of 149,713,149 people shows a moderate negative correlation between the proportion of Cajuns and percentage of population with at least high school diploma education in the United States with a correlation coefficient (R) of -0.487 and weighted average of 87.3%, a difference of 0.59%.
High School Diploma Correlation Summary
| Measurement | Peruvian | Cajun |
| Minimum | 68.1% | 58.4% |
| Maximum | 100.0% | 100.0% |
| Range | 31.9% | 41.6% |
| Mean | 87.9% | 83.6% |
| Median | 88.8% | 84.5% |
| Interquartile 25% (IQ1) | 85.5% | 79.8% |
| Interquartile 75% (IQ3) | 90.8% | 88.4% |
| Interquartile Range (IQR) | 5.3% | 8.7% |
| Standard Deviation (Sample) | 6.1% | 6.9% |
| Standard Deviation (Population) | 6.1% | 6.8% |
Demographics Similar to Peruvians and Cajuns by High School Diploma
In terms of high school diploma, the demographic groups most similar to Peruvians are Immigrants from Philippines (87.8%, a difference of 0.010%), Choctaw (87.8%, a difference of 0.010%), Immigrants from Eritrea (87.8%, a difference of 0.030%), Cheyenne (87.8%, a difference of 0.040%), and Immigrants from Costa Rica (87.8%, a difference of 0.040%). Similarly, the demographic groups most similar to Cajuns are Seminole (87.3%, a difference of 0.020%), Immigrants from Peru (87.3%, a difference of 0.050%), Immigrants from Ghana (87.4%, a difference of 0.080%), Immigrants from Western Africa (87.4%, a difference of 0.080%), and African (87.5%, a difference of 0.19%).
| Demographics | Rating | Rank | High School Diploma |
| Cheyenne | 2.1 /100 | #242 | Tragic 87.8% |
| Immigrants | Philippines | 1.9 /100 | #243 | Tragic 87.8% |
| Choctaw | 1.9 /100 | #244 | Tragic 87.8% |
| Peruvians | 1.9 /100 | #245 | Tragic 87.8% |
| Immigrants | Eritrea | 1.7 /100 | #246 | Tragic 87.8% |
| Immigrants | Costa Rica | 1.7 /100 | #247 | Tragic 87.8% |
| Spanish Americans | 1.5 /100 | #248 | Tragic 87.7% |
| Senegalese | 1.5 /100 | #249 | Tragic 87.7% |
| Immigrants | Nigeria | 1.5 /100 | #250 | Tragic 87.7% |
| Ghanaians | 1.4 /100 | #251 | Tragic 87.7% |
| Immigrants | South America | 1.2 /100 | #252 | Tragic 87.6% |
| Immigrants | Uruguay | 1.0 /100 | #253 | Tragic 87.6% |
| Immigrants | Colombia | 1.0 /100 | #254 | Tragic 87.6% |
| Immigrants | Senegal | 0.9 /100 | #255 | Tragic 87.6% |
| Africans | 0.7 /100 | #256 | Tragic 87.5% |
| Bahamians | 0.7 /100 | #257 | Tragic 87.5% |
| Immigrants | Ghana | 0.5 /100 | #258 | Tragic 87.4% |
| Immigrants | Western Africa | 0.5 /100 | #259 | Tragic 87.4% |
| Cajuns | 0.4 /100 | #260 | Tragic 87.3% |
| Seminole | 0.4 /100 | #261 | Tragic 87.3% |
| Immigrants | Peru | 0.4 /100 | #262 | Tragic 87.3% |