Peruvian vs Immigrants from Zaire 10th Grade
COMPARE
Peruvian
Immigrants from Zaire
10th Grade
10th Grade Comparison
Peruvians
Immigrants from Zaire
92.6%
10TH GRADE
0.4/ 100
METRIC RATING
264th/ 347
METRIC RANK
93.4%
10TH GRADE
16.7/ 100
METRIC RATING
212th/ 347
METRIC RANK
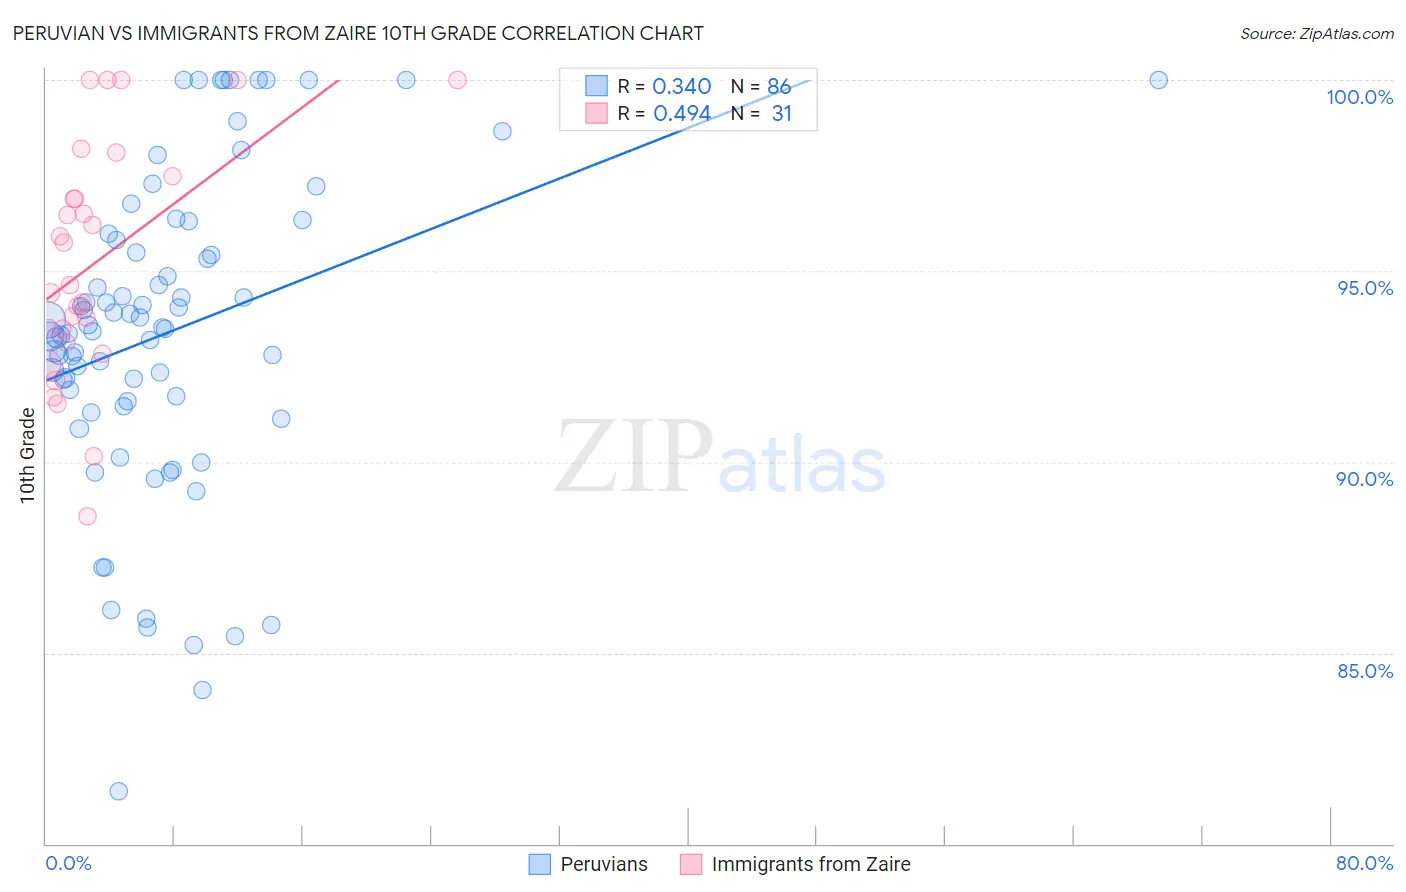
Peruvian vs Immigrants from Zaire 10th Grade Correlation Chart
The statistical analysis conducted on geographies consisting of 363,251,075 people shows a mild positive correlation between the proportion of Peruvians and percentage of population with at least 10th grade education in the United States with a correlation coefficient (R) of 0.340 and weighted average of 92.6%. Similarly, the statistical analysis conducted on geographies consisting of 107,212,695 people shows a moderate positive correlation between the proportion of Immigrants from Zaire and percentage of population with at least 10th grade education in the United States with a correlation coefficient (R) of 0.494 and weighted average of 93.4%, a difference of 0.88%.
10th Grade Correlation Summary
| Measurement | Peruvian | Immigrants from Zaire |
| Minimum | 81.4% | 88.6% |
| Maximum | 100.0% | 100.0% |
| Range | 18.6% | 11.4% |
| Mean | 93.4% | 95.3% |
| Median | 93.5% | 94.6% |
| Interquartile 25% (IQ1) | 91.6% | 93.1% |
| Interquartile 75% (IQ3) | 95.8% | 97.5% |
| Interquartile Range (IQR) | 4.2% | 4.4% |
| Standard Deviation (Sample) | 4.1% | 3.1% |
| Standard Deviation (Population) | 4.1% | 3.0% |
Similar Demographics by 10th Grade
Demographics Similar to Peruvians by 10th Grade
In terms of 10th grade, the demographic groups most similar to Peruvians are Immigrants from South America (92.6%, a difference of 0.0%), Apache (92.6%, a difference of 0.0%), Paiute (92.6%, a difference of 0.010%), Dutch West Indian (92.6%, a difference of 0.030%), and Immigrants from Philippines (92.6%, a difference of 0.030%).
| Demographics | Rating | Rank | 10th Grade |
| U.S. Virgin Islanders | 0.7 /100 | #257 | Tragic 92.7% |
| Immigrants | Costa Rica | 0.6 /100 | #258 | Tragic 92.7% |
| Immigrants | Jamaica | 0.5 /100 | #259 | Tragic 92.6% |
| Immigrants | Uzbekistan | 0.5 /100 | #260 | Tragic 92.6% |
| Paiute | 0.4 /100 | #261 | Tragic 92.6% |
| Immigrants | South America | 0.4 /100 | #262 | Tragic 92.6% |
| Apache | 0.4 /100 | #263 | Tragic 92.6% |
| Peruvians | 0.4 /100 | #264 | Tragic 92.6% |
| Dutch West Indians | 0.4 /100 | #265 | Tragic 92.6% |
| Immigrants | Philippines | 0.4 /100 | #266 | Tragic 92.6% |
| Taiwanese | 0.3 /100 | #267 | Tragic 92.5% |
| Immigrants | Ghana | 0.3 /100 | #268 | Tragic 92.5% |
| Immigrants | Colombia | 0.3 /100 | #269 | Tragic 92.5% |
| Immigrants | Uruguay | 0.3 /100 | #270 | Tragic 92.5% |
| Immigrants | Eritrea | 0.3 /100 | #271 | Tragic 92.5% |
Demographics Similar to Immigrants from Zaire by 10th Grade
In terms of 10th grade, the demographic groups most similar to Immigrants from Zaire are Cajun (93.4%, a difference of 0.0%), Indian (Asian) (93.4%, a difference of 0.010%), Immigrants from Asia (93.4%, a difference of 0.020%), Immigrants from Bahamas (93.4%, a difference of 0.020%), and Immigrants from Chile (93.4%, a difference of 0.030%).
| Demographics | Rating | Rank | 10th Grade |
| Immigrants | Indonesia | 20.2 /100 | #205 | Fair 93.4% |
| Immigrants | Sudan | 20.0 /100 | #206 | Fair 93.4% |
| Samoans | 19.5 /100 | #207 | Poor 93.4% |
| Immigrants | Syria | 19.4 /100 | #208 | Poor 93.4% |
| Immigrants | Chile | 18.8 /100 | #209 | Poor 93.4% |
| Indians (Asian) | 17.6 /100 | #210 | Poor 93.4% |
| Cajuns | 16.9 /100 | #211 | Poor 93.4% |
| Immigrants | Zaire | 16.7 /100 | #212 | Poor 93.4% |
| Immigrants | Asia | 15.7 /100 | #213 | Poor 93.4% |
| Immigrants | Bahamas | 15.2 /100 | #214 | Poor 93.4% |
| Immigrants | Oceania | 15.1 /100 | #215 | Poor 93.4% |
| Immigrants | Eastern Africa | 14.7 /100 | #216 | Poor 93.4% |
| Portuguese | 12.1 /100 | #217 | Poor 93.3% |
| Immigrants | Liberia | 10.2 /100 | #218 | Poor 93.3% |
| Seminole | 10.2 /100 | #219 | Poor 93.3% |