Peruvian vs Kenyan 10th Grade
COMPARE
Peruvian
Kenyan
10th Grade
10th Grade Comparison
Peruvians
Kenyans
92.6%
10TH GRADE
0.4/ 100
METRIC RATING
264th/ 347
METRIC RANK
94.0%
10TH GRADE
79.1/ 100
METRIC RATING
151st/ 347
METRIC RANK
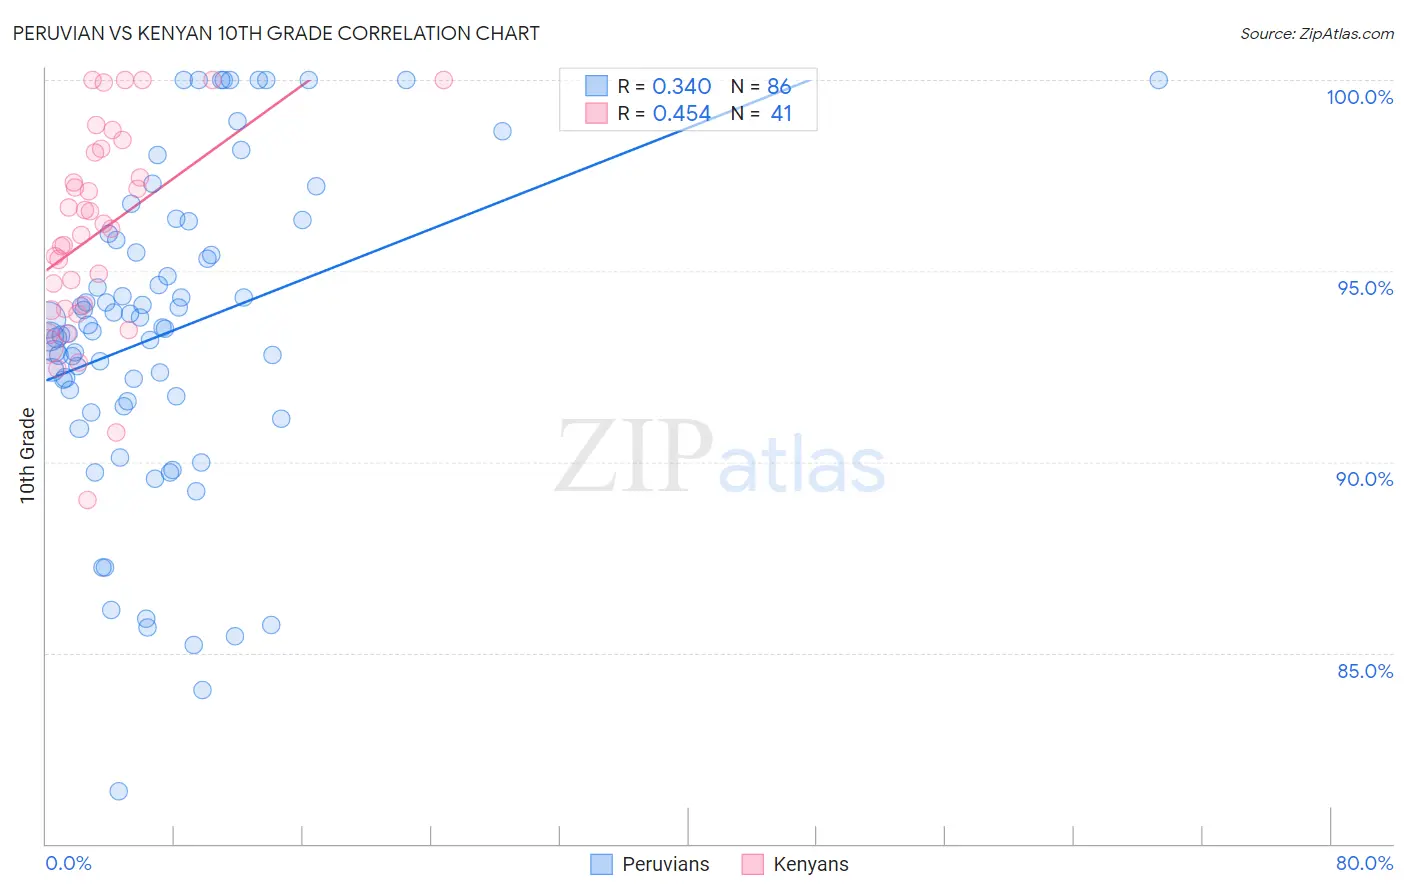
Peruvian vs Kenyan 10th Grade Correlation Chart
The statistical analysis conducted on geographies consisting of 363,251,075 people shows a mild positive correlation between the proportion of Peruvians and percentage of population with at least 10th grade education in the United States with a correlation coefficient (R) of 0.340 and weighted average of 92.6%. Similarly, the statistical analysis conducted on geographies consisting of 168,244,042 people shows a moderate positive correlation between the proportion of Kenyans and percentage of population with at least 10th grade education in the United States with a correlation coefficient (R) of 0.454 and weighted average of 94.0%, a difference of 1.5%.
10th Grade Correlation Summary
| Measurement | Peruvian | Kenyan |
| Minimum | 81.4% | 89.0% |
| Maximum | 100.0% | 100.0% |
| Range | 18.6% | 11.0% |
| Mean | 93.4% | 96.0% |
| Median | 93.5% | 96.1% |
| Interquartile 25% (IQ1) | 91.6% | 94.0% |
| Interquartile 75% (IQ3) | 95.8% | 98.2% |
| Interquartile Range (IQR) | 4.2% | 4.2% |
| Standard Deviation (Sample) | 4.1% | 2.7% |
| Standard Deviation (Population) | 4.1% | 2.6% |
Similar Demographics by 10th Grade
Demographics Similar to Peruvians by 10th Grade
In terms of 10th grade, the demographic groups most similar to Peruvians are Immigrants from South America (92.6%, a difference of 0.0%), Apache (92.6%, a difference of 0.0%), Paiute (92.6%, a difference of 0.010%), Dutch West Indian (92.6%, a difference of 0.030%), and Immigrants from Philippines (92.6%, a difference of 0.030%).
| Demographics | Rating | Rank | 10th Grade |
| U.S. Virgin Islanders | 0.7 /100 | #257 | Tragic 92.7% |
| Immigrants | Costa Rica | 0.6 /100 | #258 | Tragic 92.7% |
| Immigrants | Jamaica | 0.5 /100 | #259 | Tragic 92.6% |
| Immigrants | Uzbekistan | 0.5 /100 | #260 | Tragic 92.6% |
| Paiute | 0.4 /100 | #261 | Tragic 92.6% |
| Immigrants | South America | 0.4 /100 | #262 | Tragic 92.6% |
| Apache | 0.4 /100 | #263 | Tragic 92.6% |
| Peruvians | 0.4 /100 | #264 | Tragic 92.6% |
| Dutch West Indians | 0.4 /100 | #265 | Tragic 92.6% |
| Immigrants | Philippines | 0.4 /100 | #266 | Tragic 92.6% |
| Taiwanese | 0.3 /100 | #267 | Tragic 92.5% |
| Immigrants | Ghana | 0.3 /100 | #268 | Tragic 92.5% |
| Immigrants | Colombia | 0.3 /100 | #269 | Tragic 92.5% |
| Immigrants | Uruguay | 0.3 /100 | #270 | Tragic 92.5% |
| Immigrants | Eritrea | 0.3 /100 | #271 | Tragic 92.5% |
Demographics Similar to Kenyans by 10th Grade
In terms of 10th grade, the demographic groups most similar to Kenyans are Egyptian (94.0%, a difference of 0.010%), Immigrants from Italy (94.0%, a difference of 0.010%), Ugandan (94.0%, a difference of 0.020%), Immigrants from Ukraine (94.0%, a difference of 0.030%), and Arab (94.0%, a difference of 0.030%).
| Demographics | Rating | Rank | 10th Grade |
| Immigrants | Kazakhstan | 84.9 /100 | #144 | Excellent 94.1% |
| Immigrants | Nonimmigrants | 83.8 /100 | #145 | Excellent 94.1% |
| Chickasaw | 82.6 /100 | #146 | Excellent 94.1% |
| Immigrants | Ukraine | 81.5 /100 | #147 | Excellent 94.0% |
| Arabs | 80.9 /100 | #148 | Excellent 94.0% |
| Ugandans | 80.7 /100 | #149 | Excellent 94.0% |
| Egyptians | 79.6 /100 | #150 | Good 94.0% |
| Kenyans | 79.1 /100 | #151 | Good 94.0% |
| Immigrants | Italy | 78.0 /100 | #152 | Good 94.0% |
| Immigrants | Brazil | 75.5 /100 | #153 | Good 94.0% |
| Immigrants | Kenya | 75.3 /100 | #154 | Good 94.0% |
| Spanish | 74.9 /100 | #155 | Good 94.0% |
| Mongolians | 74.4 /100 | #156 | Good 94.0% |
| Kiowa | 73.3 /100 | #157 | Good 93.9% |
| Bermudans | 71.0 /100 | #158 | Good 93.9% |