Lebanese vs Immigrants from Zaire 10th Grade

COMPARE

Lebanese
Race
Ancestry
AfghanAfricanAlaska NativeAlaskan AthabascanAlbanianAleutAlsatianAmericanApacheArabArapahoArgentineanArmenianAssyrian/Chaldean/SyriacAustralianAustrianBahamianBangladeshiBarbadianBasqueBelgianBelizeanBermudanBhutaneseBlackfeetBolivianBrazilianBritishBritish West IndianBulgarianBurmeseCajunCambodianCanadianCape VerdeanCarpatho RusynCelticCentral AmericanCentral American IndianCherokeeCheyenneChickasawChileanChineseChippewaChoctawColombianColvilleComancheCosta RicanCreeCreekCroatianCrowCubanCypriotCzechCzechoslovakianDanishDelawareDominicanDutchDutch West IndianEastern EuropeanEcuadorianEgyptianEnglishEstonianEthiopianEuropeanFijianFilipinoFinnishFrenchFrench American IndianFrench CanadianGermanGerman RussianGhanaianGreekGuamanian/ChamorroGuatemalanGuyaneseHaitianHmongHonduranHopiHoumaHungarianIcelanderIndian (Asian)IndonesianInupiatIranianIraqiIrishIroquoisIsraeliItalianJamaicanJapaneseJordanianKenyanKiowaKoreanLaotianLatvianLebaneseLiberianLithuanianLumbeeLuxembourgerMacedonianMalaysianMalteseMarshalleseMenomineeMexicanMexican American IndianMongolianMoroccanNative HawaiianNavajoNepaleseNew ZealanderNicaraguanNigerianNorthern EuropeanNorwegianOkinawanOsageOttawaPaiutePakistaniPalestinianPanamanianParaguayanPennsylvania GermanPeruvianPimaPolishPortuguesePotawatomiPuebloPuerto RicanPuget Sound SalishRomanianRussianSalvadoranSamoanScandinavianScotch-IrishScottishSeminoleSenegaleseSerbianShoshoneSierra LeoneanSiouxSlavicSlovakSloveneSomaliSouth AfricanSouth AmericanSouth American IndianSoviet UnionSpaniardSpanishSpanish AmericanSpanish American IndianSri LankanSubsaharan AfricanSudaneseSwedishSwissSyrianTaiwaneseThaiTlingit-HaidaTohono O'OdhamTonganTrinidadian and TobagonianTsimshianTurkishU.S. Virgin IslanderUgandanUkrainianUruguayanUteVenezuelanVietnameseWelshWest IndianYakamaYaquiYugoslavianYumanYup'ikZimbabwean
Immigration
NonimmigrantsImmigrantsAfghanistanAfricaAlbaniaArgentinaArmeniaAsiaAustraliaAustriaBahamasBangladeshBarbadosBelarusBelgiumBelizeBoliviaBosnia and HerzegovinaBrazilBulgariaBurma/MyanmarCabo VerdeCambodiaCameroonCanadaCaribbeanCentral AmericaChileChinaColombiaCongoCosta RicaCroatiaCubaCzechoslovakiaDenmarkDominicaDominican RepublicEastern AfricaEastern AsiaEastern EuropeEcuadorEgyptEl SalvadorEnglandEritreaEthiopiaEuropeFijiFranceGermanyGhanaGreeceGrenadaGuatemalaGuyanaHaitiHondurasHong KongHungaryIndiaIndonesiaIranIraqIrelandIsraelItalyJamaicaJapanJordanKazakhstanKenyaKoreaKuwaitLaosLatin AmericaLatviaLebanonLiberiaLithuaniaMalaysiaMexicoMicronesiaMiddle AfricaMoldovaMoroccoNepalNetherlandsNicaraguaNigeriaNorth AmericaNorth MacedoniaNorthern AfricaNorthern EuropeNorwayOceaniaPakistanPanamaPeruPhilippinesPolandPortugalRomaniaRussiaSaudi ArabiaScotlandSenegalSerbiaSierra LeoneSingaporeSomaliaSouth AfricaSouth AmericaSouth Central AsiaSouth Eastern AsiaSouthern EuropeSpainSri LankaSt. Vincent and the GrenadinesSudanSwedenSwitzerlandSyriaTaiwanThailandTrinidad and TobagoTurkeyUgandaUkraineUruguayUzbekistanVenezuelaVietnamWest IndiesWestern AfricaWestern AsiaWestern EuropeYemenZimbabweAzores
Immigrants from Zaire
Race
Ancestry
AfghanAfricanAlaska NativeAlaskan AthabascanAlbanianAleutAlsatianAmericanApacheArabArapahoArgentineanArmenianAssyrian/Chaldean/SyriacAustralianAustrianBahamianBangladeshiBarbadianBasqueBelgianBelizeanBermudanBhutaneseBlackfeetBolivianBrazilianBritishBritish West IndianBulgarianBurmeseCajunCambodianCanadianCape VerdeanCarpatho RusynCelticCentral AmericanCentral American IndianCherokeeCheyenneChickasawChileanChineseChippewaChoctawColombianColvilleComancheCosta RicanCreeCreekCroatianCrowCubanCypriotCzechCzechoslovakianDanishDelawareDominicanDutchDutch West IndianEastern EuropeanEcuadorianEgyptianEnglishEstonianEthiopianEuropeanFijianFilipinoFinnishFrenchFrench American IndianFrench CanadianGermanGerman RussianGhanaianGreekGuamanian/ChamorroGuatemalanGuyaneseHaitianHmongHonduranHopiHoumaHungarianIcelanderIndian (Asian)IndonesianInupiatIranianIraqiIrishIroquoisIsraeliItalianJamaicanJapaneseJordanianKenyanKiowaKoreanLaotianLatvianLiberianLithuanianLumbeeLuxembourgerMacedonianMalaysianMalteseMarshalleseMenomineeMexicanMexican American IndianMongolianMoroccanNative HawaiianNavajoNepaleseNew ZealanderNicaraguanNigerianNorthern EuropeanNorwegianOkinawanOsageOttawaPaiutePakistaniPalestinianPanamanianParaguayanPennsylvania GermanPeruvianPimaPolishPortuguesePotawatomiPuebloPuerto RicanPuget Sound SalishRomanianRussianSalvadoranSamoanScandinavianScotch-IrishScottishSeminoleSenegaleseSerbianShoshoneSierra LeoneanSiouxSlavicSlovakSloveneSomaliSouth AfricanSouth AmericanSouth American IndianSoviet UnionSpaniardSpanishSpanish AmericanSpanish American IndianSri LankanSubsaharan AfricanSudaneseSwedishSwissSyrianTaiwaneseThaiTlingit-HaidaTohono O'OdhamTonganTrinidadian and TobagonianTsimshianTurkishU.S. Virgin IslanderUgandanUkrainianUruguayanUteVenezuelanVietnameseWelshWest IndianYakamaYaquiYugoslavianYumanYup'ikZimbabwean
Immigration
NonimmigrantsImmigrantsAfghanistanAfricaAlbaniaArgentinaArmeniaAsiaAustraliaAustriaBahamasBangladeshBarbadosBelarusBelgiumBelizeBoliviaBosnia and HerzegovinaBrazilBulgariaBurma/MyanmarCabo VerdeCambodiaCameroonCanadaCaribbeanCentral AmericaChileChinaColombiaCongoCosta RicaCroatiaCubaCzechoslovakiaDenmarkDominicaDominican RepublicEastern AfricaEastern AsiaEastern EuropeEcuadorEgyptEl SalvadorEnglandEritreaEthiopiaEuropeFijiFranceGermanyGhanaGreeceGrenadaGuatemalaGuyanaHaitiHondurasHong KongHungaryIndiaIndonesiaIranIraqIrelandIsraelItalyJamaicaJapanJordanKazakhstanKenyaKoreaKuwaitLaosLatin AmericaLatviaLebanonLiberiaLithuaniaMalaysiaMexicoMicronesiaMiddle AfricaMoldovaMoroccoNepalNetherlandsNicaraguaNigeriaNorth AmericaNorth MacedoniaNorthern AfricaNorthern EuropeNorwayOceaniaPakistanPanamaPeruPhilippinesPolandPortugalRomaniaRussiaSaudi ArabiaScotlandSenegalSerbiaSierra LeoneSingaporeSomaliaSouth AfricaSouth AmericaSouth Central AsiaSouth Eastern AsiaSouthern EuropeSpainSri LankaSt. Vincent and the GrenadinesSudanSwedenSwitzerlandSyriaTaiwanThailandTrinidad and TobagoTurkeyUgandaUkraineUruguayUzbekistanVenezuelaVietnamWest IndiesWestern AfricaWestern AsiaWestern EuropeYemenZaireZimbabweAzores
10th Grade
Income
Poverty
Unemployment
Labor Participation
Family Structure
Vehicle Availability
Education Level
Disability

10th Grade Comparison

Lebanese

Immigrants from Zaire

Exceptional
Poor
94.6%
10TH GRADE
98.3/ 100
METRIC RATING
97th/ 347
METRIC RANK
93.4%
10TH GRADE
16.7/ 100
METRIC RATING
212th/ 347
METRIC RANK

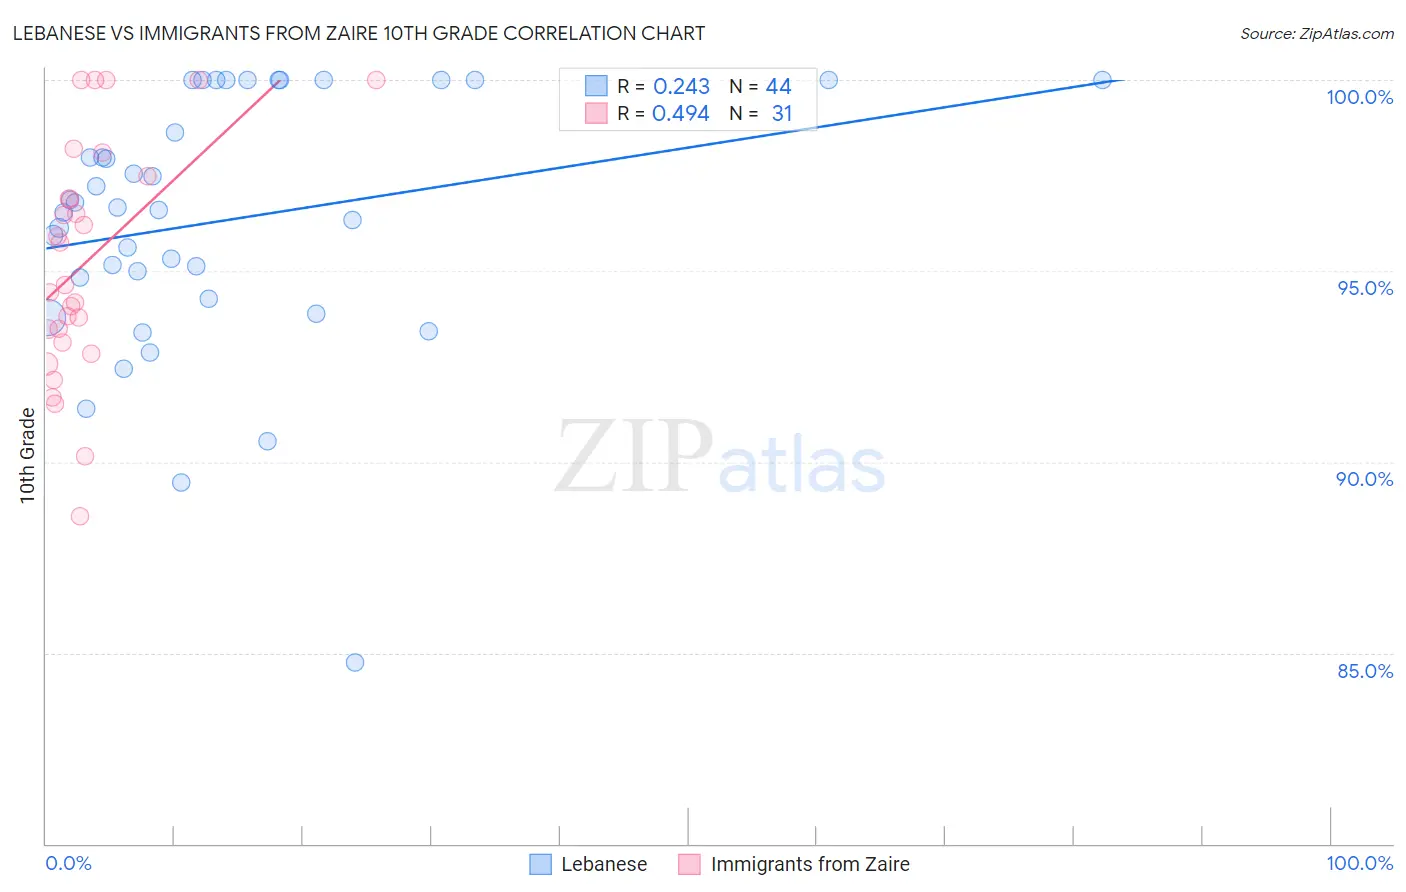
Lebanese vs Immigrants from Zaire 10th Grade Correlation Chart

The statistical analysis conducted on geographies consisting of 401,624,157 people shows a weak positive correlation between the proportion of Lebanese and percentage of population with at least 10th grade education in the United States with a correlation coefficient (R) of 0.243 and weighted average of 94.6%. Similarly, the statistical analysis conducted on geographies consisting of 107,212,695 people shows a moderate positive correlation between the proportion of Immigrants from Zaire and percentage of population with at least 10th grade education in the United States with a correlation coefficient (R) of 0.494 and weighted average of 93.4%, a difference of 1.3%.
Lebanese vs Immigrants from Zaire 10th Grade

10th Grade Correlation Summary

MeasurementLebaneseImmigrants from Zaire
Minimum84.7%88.6%
Maximum100.0%100.0%
Range15.3%11.4%
Mean96.3%95.3%
Median96.6%94.6%
Interquartile 25% (IQ1)94.5%93.1%
Interquartile 75% (IQ3)100.0%97.5%
Interquartile Range (IQR)5.5%4.4%
Standard Deviation (Sample)3.4%3.1%
Standard Deviation (Population)3.3%3.0%

Similar Demographics by 10th Grade

Demographics Similar to Lebanese by 10th Grade

In terms of 10th grade, the demographic groups most similar to Lebanese are Menominee (94.6%, a difference of 0.0%), Immigrants from Switzerland (94.6%, a difference of 0.0%), Soviet Union (94.6%, a difference of 0.010%), Immigrants from Germany (94.6%, a difference of 0.010%), and Yugoslavian (94.6%, a difference of 0.020%).
DemographicsRating | Rank10th Grade
South Africans
98.8
/100
|
#90
Exceptional
94.7%
Whites/Caucasians
98.8
/100
|
#91
Exceptional
94.7%
Yugoslavians
98.4
/100
|
#92
Exceptional
94.6%
Soviet Union
98.3
/100
|
#93
Exceptional
94.6%
Immigrants | Germany
98.3
/100
|
#94
Exceptional
94.6%
Menominee
98.3
/100
|
#95
Exceptional
94.6%
Immigrants | Switzerland
98.3
/100
|
#96
Exceptional
94.6%
Lebanese
98.3
/100
|
#97
Exceptional
94.6%
Immigrants | Bulgaria
98.1
/100
|
#98
Exceptional
94.6%
Immigrants | France
97.9
/100
|
#99
Exceptional
94.5%
Immigrants | South Central Asia
97.8
/100
|
#100
Exceptional
94.5%
Syrians
97.7
/100
|
#101
Exceptional
94.5%
Cambodians
97.6
/100
|
#102
Exceptional
94.5%
Immigrants | Europe
97.5
/100
|
#103
Exceptional
94.5%
Immigrants | Romania
97.5
/100
|
#104
Exceptional
94.5%

Demographics Similar to Immigrants from Zaire by 10th Grade

In terms of 10th grade, the demographic groups most similar to Immigrants from Zaire are Cajun (93.4%, a difference of 0.0%), Indian (Asian) (93.4%, a difference of 0.010%), Immigrants from Asia (93.4%, a difference of 0.020%), Immigrants from Bahamas (93.4%, a difference of 0.020%), and Immigrants from Chile (93.4%, a difference of 0.030%).
DemographicsRating | Rank10th Grade
Immigrants | Indonesia
20.2
/100
|
#205
Fair
93.4%
Immigrants | Sudan
20.0
/100
|
#206
Fair
93.4%
Samoans
19.5
/100
|
#207
Poor
93.4%
Immigrants | Syria
19.4
/100
|
#208
Poor
93.4%
Immigrants | Chile
18.8
/100
|
#209
Poor
93.4%
Indians (Asian)
17.6
/100
|
#210
Poor
93.4%
Cajuns
16.9
/100
|
#211
Poor
93.4%
Immigrants | Zaire
16.7
/100
|
#212
Poor
93.4%
Immigrants | Asia
15.7
/100
|
#213
Poor
93.4%
Immigrants | Bahamas
15.2
/100
|
#214
Poor
93.4%
Immigrants | Oceania
15.1
/100
|
#215
Poor
93.4%
Immigrants | Eastern Africa
14.7
/100
|
#216
Poor
93.4%
Portuguese
12.1
/100
|
#217
Poor
93.3%
Immigrants | Liberia
10.2
/100
|
#218
Poor
93.3%
Seminole
10.2
/100
|
#219
Poor
93.3%